
A tiny native macOS menu-bar line for CPU, GPU, RAM, network activity, and the apps behind meaningful spikes.
Cost / License
- Paid
- Proprietary
Application type
Platforms
- Mac
 Australia

Best alternatives are 

52 alternatives


A tiny native macOS menu-bar line for CPU, GPU, RAM, network activity, and the apps behind meaningful spikes.
Australia
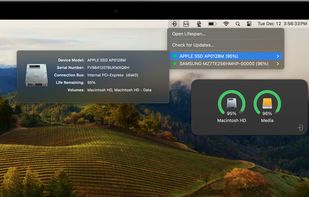
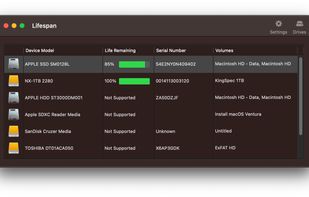
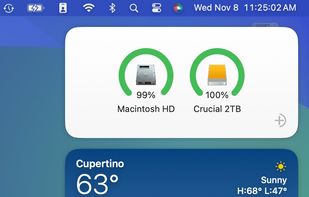
Lifespan is an innovative macOS Menu Bar application designed to monitor the remaining useful life of flash-based storage devices. Our software conveniently displays the remaining lifespan of your solid state drive (SSD).
 United States

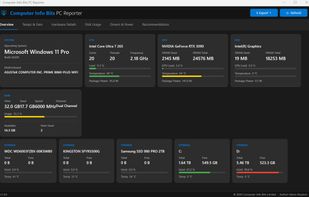
Windows 11 PC diagnostics and reporting software that combines hardware, thermals, storage health, and driver checks into one exportable report.
 New Zealand


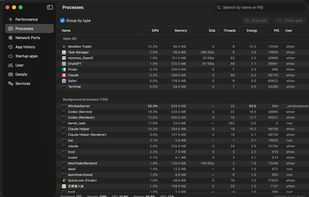
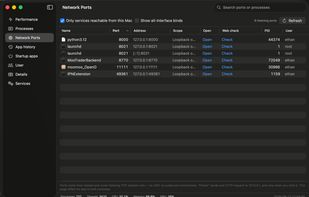
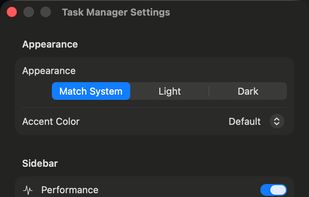
A Windows 11 Task Manager–style system monitor for macOS — processes, CPU/memory/GPU/disk/network, listening ports, startup items and services, with no password and no permission prompts.
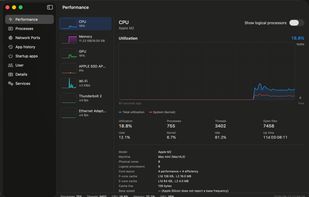

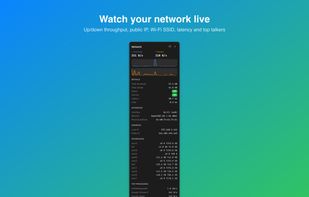
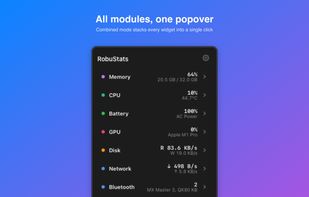
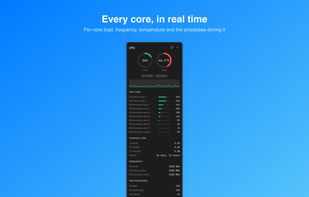
RobuStats is a menu-bar system monitor for macOS. Watch CPU, GPU, memory, network, and battery health at a glance, with live charts one click away. RobuStats is included in every getapps.cafe subscription.
United States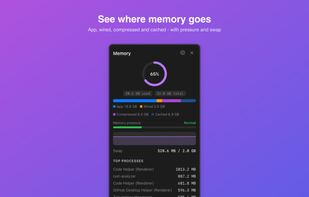


PGA System Monitor is a small Windows tray app that watches your PC in real time and shows the numbers in a small dashboard window and in the system tray next to the clock.

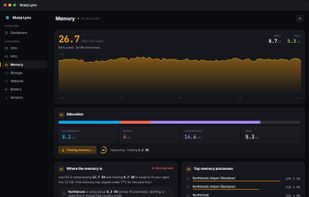
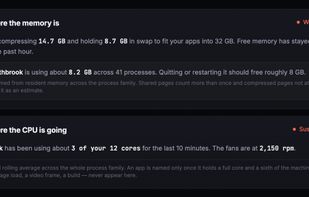
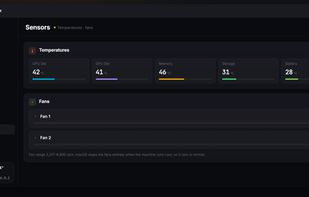
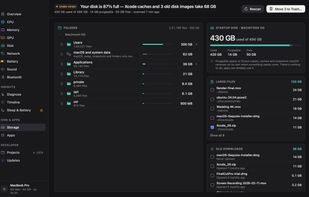
Shows Mac resource stats in menu bar and dashboard, explains system activity in plain language, reclaims memory on demand, monitors storage, network, temperatures, and requires no account or tracking.
 Hong Kong
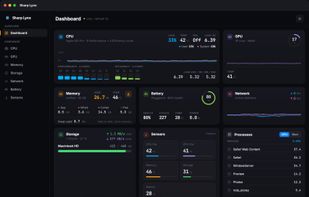

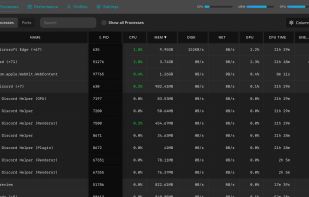
The best Windows Task Manager, macOS Activity Monitor, and Linux System Monitor alternative. A modern, cross-platform process manager to monitor CPU, memory, GPU, and more in real-time.
 United Kingdom
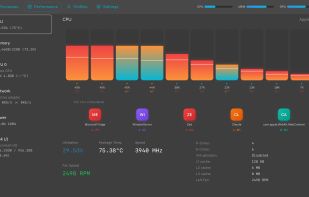
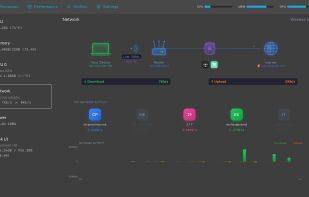
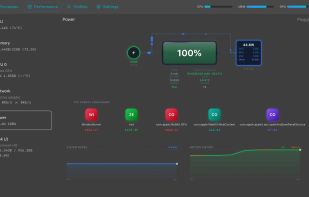
Applies 227 explained, risk-rated, one-click-reversible Windows tweaks, then verifies the gains with a real before/after FPS test.
United Kingdom
 uBlock Originand


RPi-Monitor is a software designed to monitor the metrics from GNU/Linux system and connected peripherals. It store statistic into local Round Robin Database and embed a web server allowing to display current status and statistics.



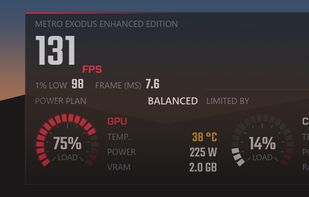
Aurora is a free hardware monitor for Windows 10 and 11. It shows temperatures, fans, drives, network and in-game FPS live on one dashboard, and explains in plain words whether the PC is doing well, what to do and what changed.
 Canada

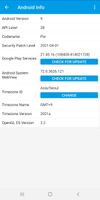
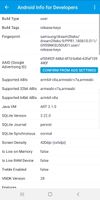
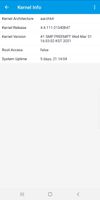
This application provides you with all the information containing Android, kernel and hardware. It also provides links to check for some updates of your Android device. For example, you can easily check for updates your Android system modules like Google Play Services, Android...

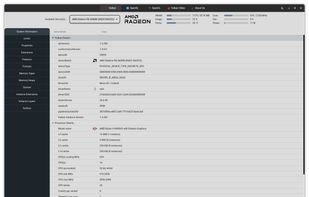
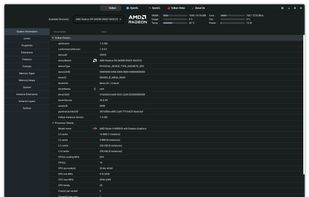
This project aims to capture all the important details of glxinfo, vulkaninfo and clinfo in a GUI. The project is being developed using python 3 pygobject with GTK4. All the important details are extracted using glxinfo/vulkaninfo/clinfo with the combination of grep, CAT, AWK...


SSD Booster .NET Edition is a portable utility designed to help boost SSD efficiency and maintain peak performance.


Bloonix is a software for monitoring IT infrastructures. With Bloonix everything can be monitored what is to be reached about a network connection and for which there is a Plugin. Hardware components can be also monitored on which Bloonix cannot be installed, as for example...
 Germany
 EU


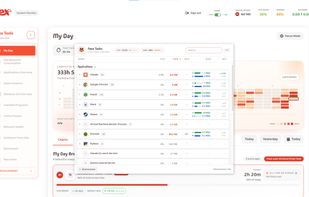
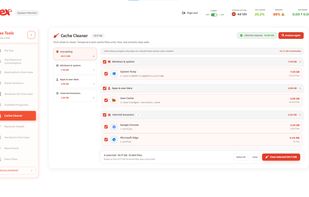
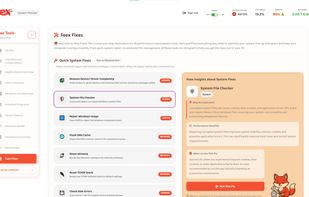
Feex is an AI assistant for your Windows PC that understands its hardware, software, and real-time behavior to answer questions, diagnose problems, and keep everything running at its best.
United States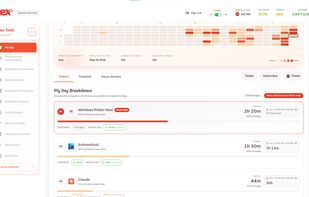

OptimumCare is a low cost Managed Services suite for your PC. It monitors PC Health, updates apps, and provides a Fully Managed Antivirus Program; and integrated tools with a built-in Remote Support service to keep your PC healthy and running great.


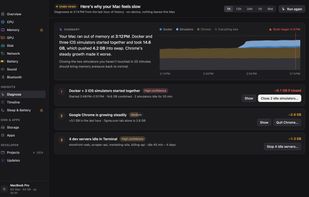
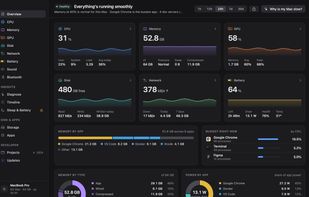
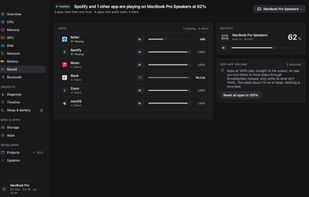
iKnowMyMac is a native Mac app that explains what your Mac is doing. It groups about 1,000 background processes into the apps they belong to, and its "Why is my Mac slow?" button reads the last hour and names the cause, with the evidence and one action for each.
 India
 Mission Centerand

A portable multifunctional application that includes performance tests and additional tools for obtaining information about the system.



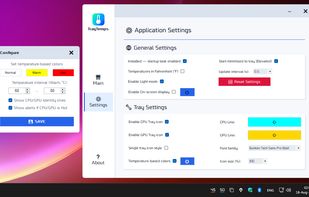
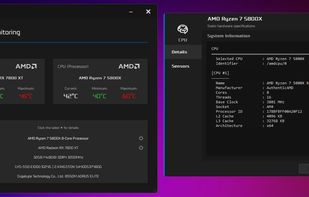
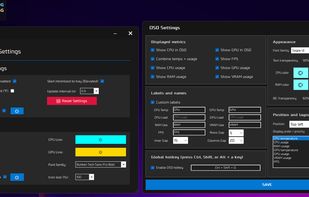
Lightweight Windows hardware monitor that displays CPU and GPU temperatures in the system tray, with a customizable OSD and built-in FPS counter.
 RomaniaEU
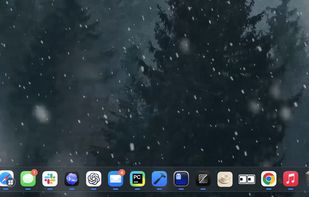
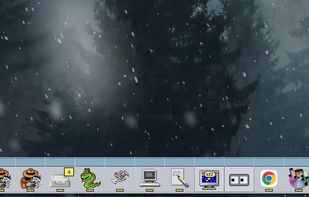
Customizes the macOS dock with window previews, keyboard switching, clipboard history, per-app audio controls, system stats, and themes.
GermanyEU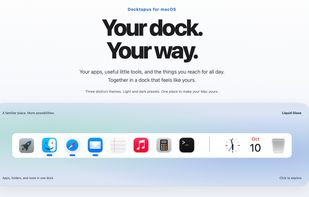


FrameView is an application for measuring frame rates, frame times, power, and performance-per-watt on a wide range of graphics cards. Integrated frame benchmarking and performance tool.


When a server goes down, it costs not only money but also productivity loss and reputational damage. The majority of the servers go down because of a full disk. Logs are getting too big, or disk images cache grows without bounds.

Hardware Identify is a program that lists all installed hardware devices on your computer and displays information about each device.


