Apps tagged with 'Hardware Monitoring' Page 2 of 11

All apps in Apps tagged with 'Hardware Monitoring' category. Use the filters below to narrow down your search. 
Copy a direct link to this comment to your clipboard
  1. HWMonitor icon
     117 likes

    HWMonitor for Windows® x86/x64 is a hardware monitoring program that reads PC system's main health sensors : voltages, temperatures, powers, currents, fans speed, utilization, clock speeds…

    Cost / License

    • Freemium
    • Proprietary

    Platforms

    • Windows
    HWMonitor screenshot 1
    44 alternatives
  2. Conky icon
     168 likes

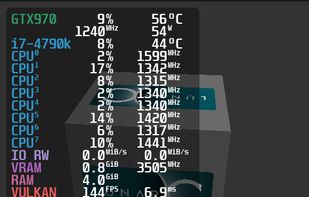
    Conky is a free, light-weight system monitor for X, that displays any kind of information on your desktop. Originally a fork of Torsmo, Conkys torsmo-based code is BSD licensed. New code in Conky has been licensed under the GPL 3.0.

    Cost / License

    Platforms

    • Linux
    • BSD
    Conky screenshot 1
    Conky screenshot 1
    Conky screenshot 2
    +3
    Conky screenshot 3
    33 alternatives
  3. Glances icon
     70 likes

    Glances is a cross-platform monitoring tool which aims to present a large amount of monitoring information through a curses or Web based interface. The information dynamically adapts depending on the size of the user interface.

    Cost / License

    • Free
    • Open Source

    Platforms

    • Mac
    • Windows
    • Linux
    • BSD
    Glances screenshot 1
    Glances screenshot 1
    Glances screenshot 2
    +1
    Glances screenshot 3
    72 alternatives
  4. Tracebar icon
     5 likes

    TraceBar puts a live traceroute in your macOS menubar. It continuously monitors the network path to any host, showing every hop’s latency, packet loss, and route changes in real time.

    Cost / License

    • Free
    • Open Source (MIT)

    Application type

    Platforms

    • Mac
    • Homebrew
    Tracebar screenshot 1
    Tracebar screenshot 1
    Tracebar screenshot 2
    +1
    Tracebar screenshot 3
    39 alternatives
  5. Nagios icon
     92 likes

    Nagios is a powerful monitoring system licensed under Nagios Enterprises that helps organizations identify and resolve IT infrastructure issues.

    Cost / License

    • Freemium
    • Open Source

    Application type

    Platforms

    • Linux
    Home
    Service Detail
    Host Detail
    150 alternatives
  6. Net Bar icon
     5 likes

    Lightweight menu bar monitor for macOS showing real-time download and upload speeds, Wi-Fi and latency stats, fully customizable appearance, and privacy focused.

    Cost / License

    • Freemium
    • Proprietary

    Application type

    Platforms

    • Mac
    Net Bar screenshot 1
    46 alternatives
  7. UNIGINE benchmarks can be effectively used to determine the stability of a GPU under extremely stressful conditions, as well as check the cooling system's potential under maximum heat output.

    Cost / License

    • Freemium
    • Proprietary

    Application type

    Platforms

    • Mac
    • Windows
    • Linux
    Valley Benchmark
    Heaven Benchmark
    Heaven Benchmark
    +2
    Heaven Benchmark
    33 alternatives
  8. Spiceworks icon
     84 likes

    Free help desk platform for IT provides ticket management, network monitoring, asset inventory, remote access, task prioritization, and automated cloud-based reporting.

    Cost / License

    • Freemium
    • Proprietary

    Platforms

    • Windows
    • Online
    Spiceworks screenshot 1
    Spiceworks screenshot 1
    Spiceworks screenshot 2
    140 alternatives
  9. Prometheus icon
     43 likes

    Prometheus is an open-source systems monitoring and alerting toolkit originally built at SoundCloud. Since its inception in 2012, many companies and organizations have adopted Prometheus, and the project has a very active developer and user community.

    Cost / License

    • Free
    • Open Source

    Platforms

    • Mac
    • Windows
    • Linux
    • Cloudron
    • Docker Hub
    Prometheus screenshot 1
    Prometheus screenshot 1
    Prometheus screenshot 2
    +1
    Prometheus screenshot 3
    81 alternatives
  10. Goverlay icon
     11 likes

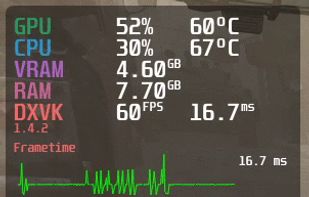
    Goverlay is an easy graphical interface to configure MangoHud, vkBasalt, and OptiScaler. Goverlay helps Linux gamers get the most out of their systems by providing an easy-to-use graphical interface to configure MangoHud, vkBasalt, and OptiScaler.

    Cost / License

    Platforms

    • Linux
    • Flathub
    • Flatpak
    Goverlay screenshot 1
    Goverlay screenshot 1
    Goverlay screenshot 2
    12 alternatives
  11. DeskDash icon
     4 likes

    DeskDash turns your Windows desktop background into a live dashboard of widgets that sit behind your open windows. Build your own or install from a secure community-based marketplace.

    Cost / License

    • Paid
    • Proprietary

    Platforms

    • Windows
    DeskDash screenshot 1
    DeskDash screenshot 1
    DeskDash screenshot 2
    +2
    DeskDash screenshot 3
    23 alternatives
  12. Hardinfo icon
     44 likes

    Hardinfo is a system information and benchmark tool for Linux. It shows detailed system info, including hardware, environment, and kernel. It can use lm_sensors and ACPI for temperature and battery information. It also has four CPU banchmarks and two FPU benchmarks.

    Cost / License

    Alerts

    • Discontinued

    Platforms

    • Linux
    • KDE
    • GNOME
    • MATE
    • Xfce
    Default View
    Temperature View
    Summary of system
    70 alternatives
  13. ACTVT icon
     6 likes

    Native macOS app shows live CPU, GPU, memory, and network stats, manages ports, tracks coding agent sessions, supports local and remote monitoring, and secures on-device data.

    Cost / License

    • Freemium
    • Proprietary

    Platforms

    • Mac
    Overview dashboard showing spend and token totals, cache efficiency, plan usage for Claude and Codex, and spend broken down by project.
    The Agent Actvt panel on the desktop, listing recent agent sessions with their status and cost alongside the live system cards.
    The menu bar item open on a Mac, with live CPU and thermal state, and the CPU, GPU, memory and network cards below it.
    +1
    The same Overview dashboard in German and in dark mode. The interface is localised in English, French and German.
    61 alternatives