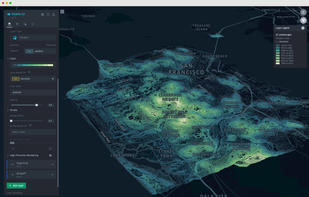
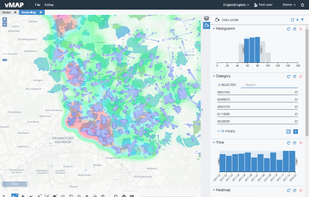
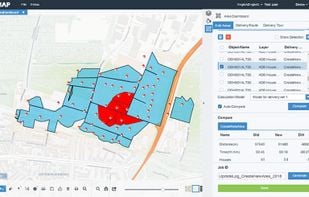
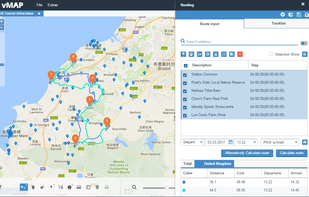
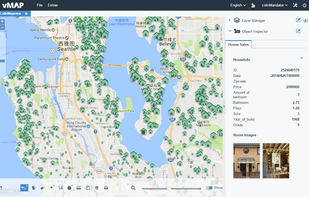
vMAP Portal is a web GIS which provides data visualization, analysis, route calculation, reporting with an easy-to-use interface, central rights & roles, and can be easily integrated with other tools like BI, CRM etc. without much coding and setups.
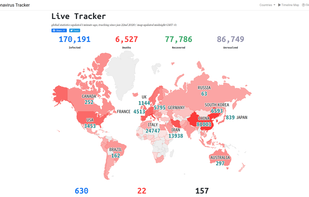
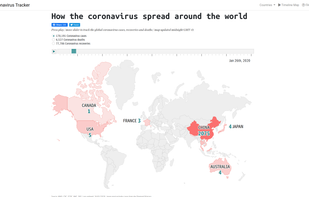
Coronavirus Tracker is a real-time service tracking the the wuhan virus with real-time data and worldwide Coronavirus news outlets updates of the COVID-19 Coronavirus. Besides stats and news, the site provides a timeline map for seeing how the virus spread over time.
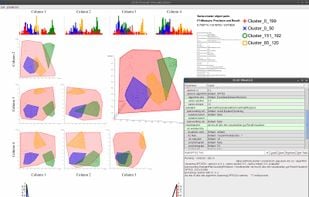
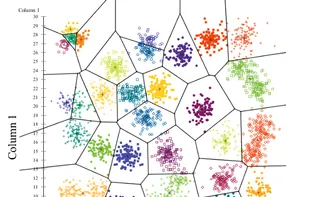
ELKI: "Environment for Developing KDD-Applications Supported by Index-Structures" is a development framework for data mining algorithms written in Java. It includes a large variety of popular data mining algorithms, distance functions and index structures.
Nugit is driven by the desire to help people realise the possibilities of data, because decisions based on data, are simply better. We aim to get rid of complexity and make the data overload manageable for everyone.
The easiest way to explore and analyze your data and share findings to any device as always-up-to-date interactive visualizations, notebooks and dashboards.
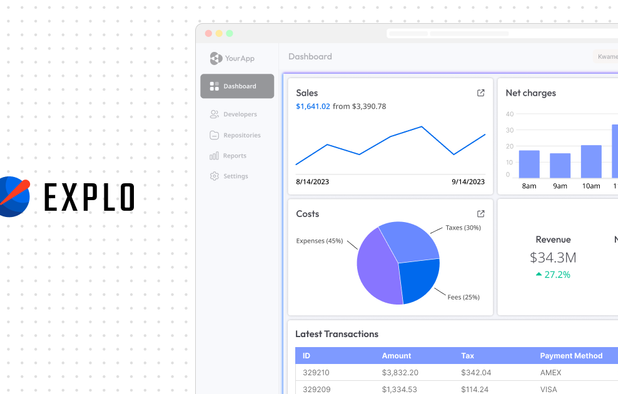
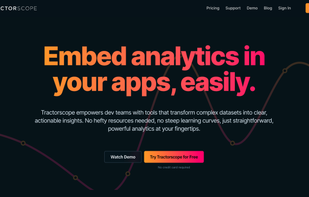
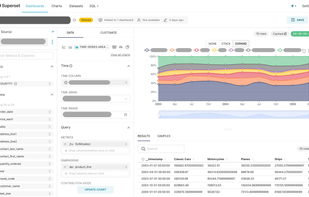
Tractorscope is the modern SQL editing and data visualization platform built by engineers and designers for developers. Embed analytics into your apps or websites with just a few lines of code, and save hundreds of hours of development time.
Datawatch is the leading provider of visual data discovery solutions that allow organizations to optimize the use of any information whether it is structured, unstructured, or semi-structured data locked in content like static reports, PDF files, and EDI streams – in real-time...
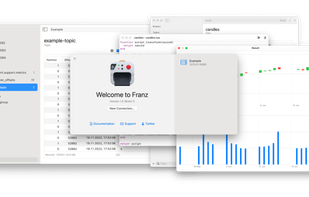
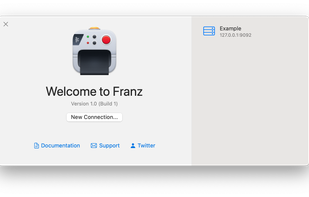
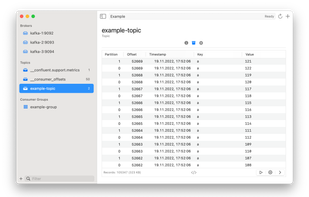
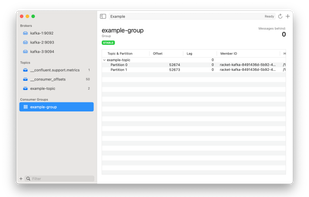
Franz is a native macOS desktop client for Apache Kafka. It is not Open Source. I'm providing the source code here because I want users to be able to see the code they're running and even change and build it for themselves if they want to.
Yanzu Data is a cloud-based data analytics and visualization application. Yanzu Data lets you quickly build robust dashboards and visualizations, or just explore your data using SQL. Setup is easy: just connect to your database and you're running.
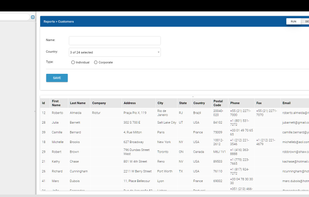
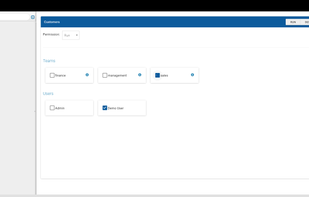
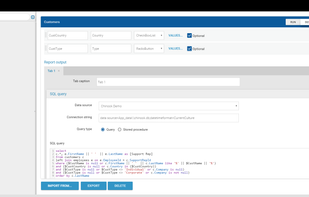
SQLwallet's mission is to streamline day-to-day ad-hoc report creating and close the gap between developers and business to get away of data being sent in attached spreadsheets. SQLwallet server allows to create table reports from SQL queries, with advanced permissions...
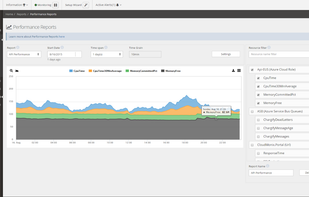
CloudMonix provides advanced cloud monitoring and automation for applications and services deployed on the Microsoft Azure and AWS platforms and built with MSPs, CSPs and DevOps in mind.
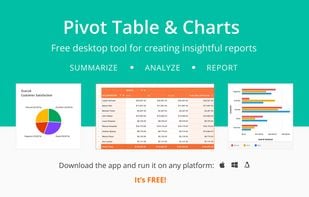
Flexmonster Pivot Table & Charts for desktop - free tool for creating insightful reports. Compose professional reports with a self-service analytics tool.
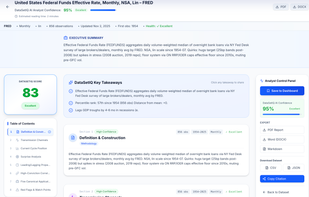
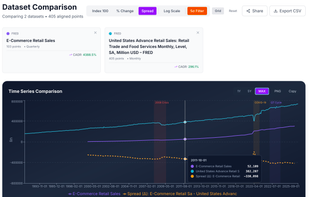
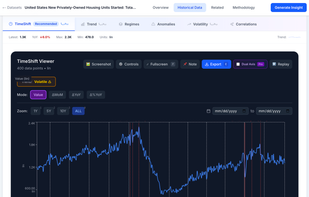
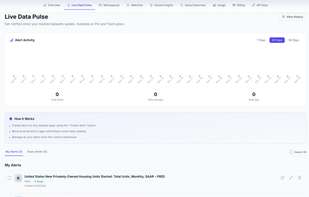
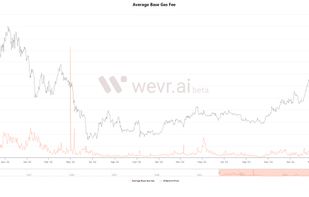
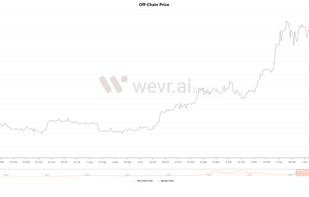
A global macro intelligence platform combining millions of economic datasets with AI-powered insights, trend/cycle analytics, TimeShift vintage data, alerts, scoring, and research packs — a modern alternative to Bloomberg-style macro research.
Progress Software (NASDAQ: PRGS) is a global provider of leading application infrastructure software to develop, deploy, integrate and manage business applications.
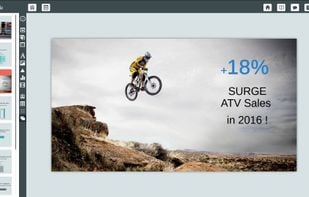
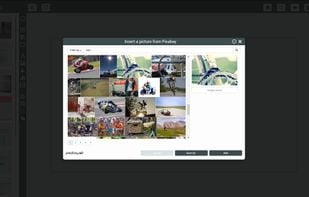
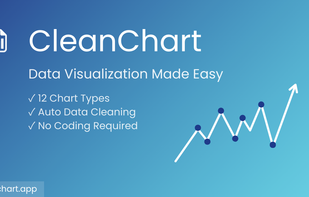
CleanChart is a no-code data visualization tool that automatically cleans messy data and transforms it into clear, professional charts in minutes. No Excel gymnastics, no scripts, just clarity.
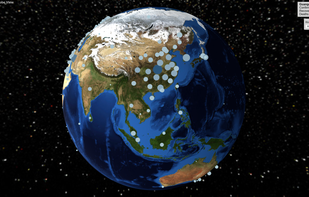
COVID-19 Globe View is a simple but helpful web app showing an interactive view of the globe with hotspots indicating reported outbreaks of the Coronavirus. Hover over hotspots or click to get details. Use the vertical timeline to track the spread of the virus over time.
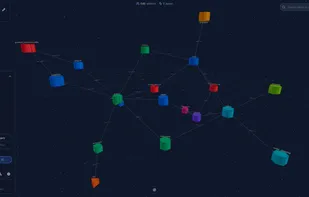
Schema3D is a free, interactive database visualization tool that transforms your database schema into a beautiful 3D representation. Whether you're a developer, database administrator, or data architect, Schema3D helps you explore tables, views, and foreign key relationships...
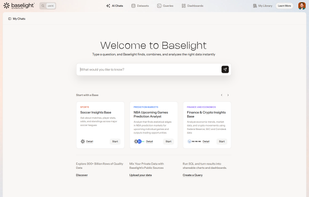
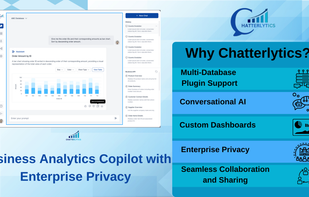
A secure, AI-driven tool transforming data analytics and Business Intelligence. It enables users to interact with their data via natural language, simplifying insights without technical expertise.
 QGISand