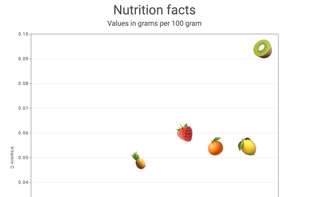
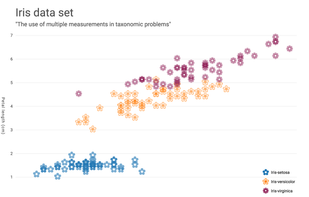
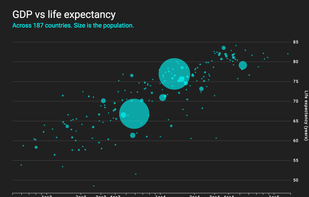
scatterplot.online is a tool for quickly creating scatter plots from data in the browser. No account, no login required. Just drag and drop csv file or copy paste it into the page and you will see your diagram in a matter of seconds.
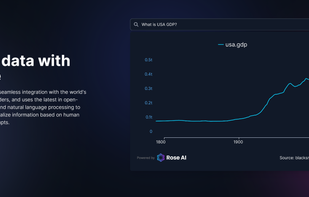
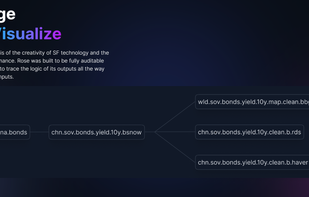
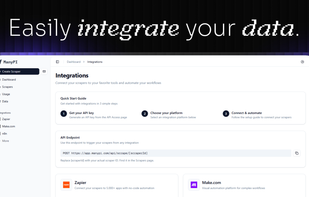
Rose is a cloud data platform designed to help users find, engage, visualize and share data. It enables integration of external and internal data, with the ability to permission data for internal teams or third parties.
LibXL is a library that can read and write Excel files. It doesn't require Microsoft Excel and .NET framework, combines an easy to use and powerful features.
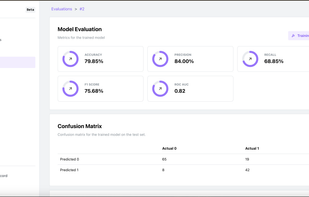
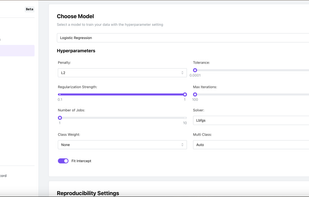
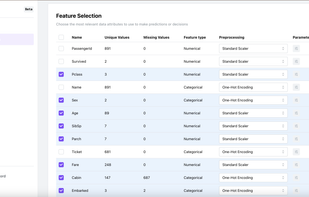
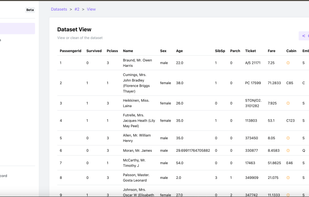
ApX is an AutoML platform that simplifies machine learning workflows by automating data prep, model building, and tuning for faster, more efficient results.
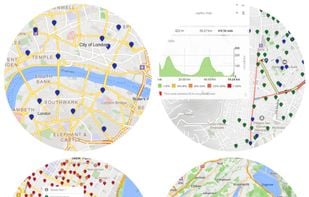
OSM-based worldwide map API and public map portal. Multi-profile directions, mapmatching, geocoding, map tiles - with easy integration, on reasonable prices.
The powerful, self serve data governance platform for businesses. Wult facilitates end to end control of data for teams and organizations. Companies need to understand their data from collection through to usage.
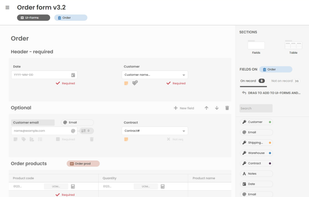
While coding with AI assist, I noticed bigger projects need something more rigid as context so the AI coder doesn't stray away when I try to add new features. You know, to keeps its memory fresh and not change the stuff that already works.
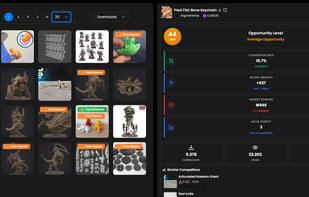
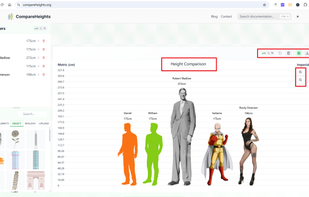
CompareHeights lets you effortlessly create beautiful, customizable height comparison charts—for people, characters, animals, objects, or virtually anything—perfect for any scenario.
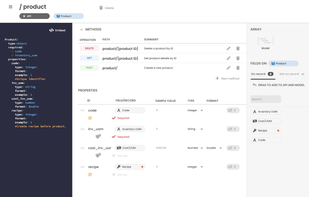
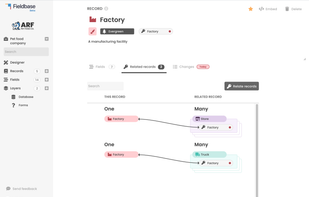
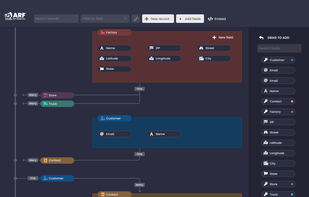
Fieldbase helps teams design, document, understand, and communicate their information architecture in large systems. The app helps to foster better cross-functional collaboration between business requirements and technical details using records, fields, behaviors, and data...
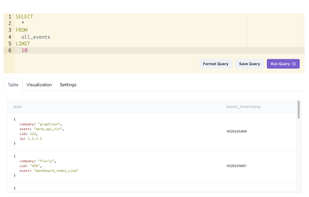
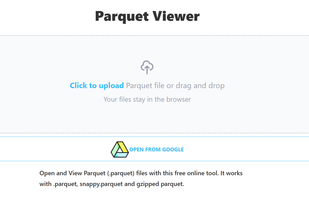
Open and filter your parquet files without writing code. If you install the desktop app then you can open parquet files from your desktop by double clicking them.
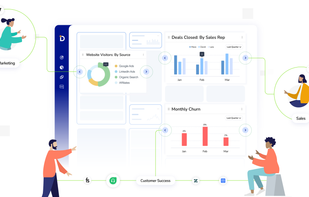
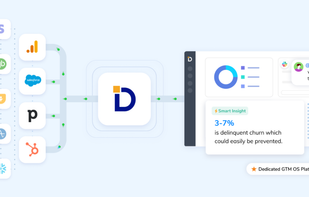
Dataflo is a data visualization platform tailor-made for leaders across the GTM functions where you can visualize, analyze, and uncover insights by building custom KPI dashboards.
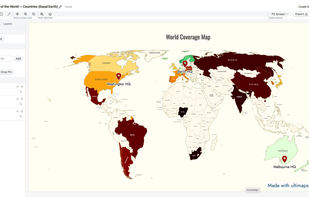
Create custom static and interactive maps with automatic data visualization: color regions manually, by importing spreadsheets or using AI prompts, no design skills required.
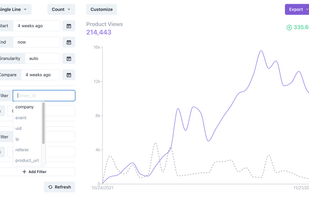
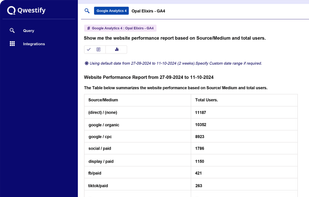
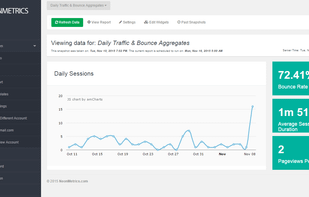
Qwestify simplifies Google Analytics 4 by transforming complex data into clear insights. It helps you quickly uncover trends, track metrics, and make smarter decisions effortlessly.
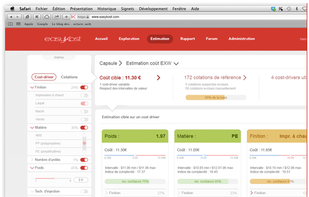
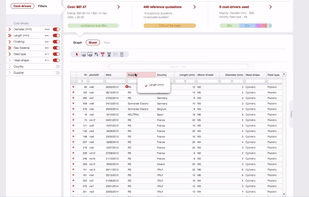
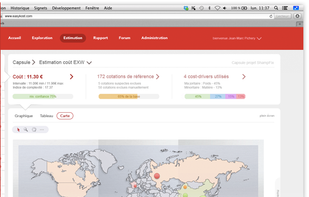
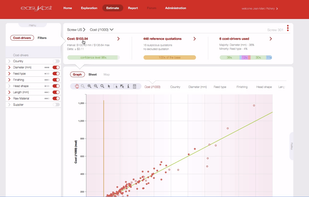
Improve design-to-cost and time-to-market performance, create operating synergy between the various jobs and functions, streamline and professionalize the costing and quotation activities.
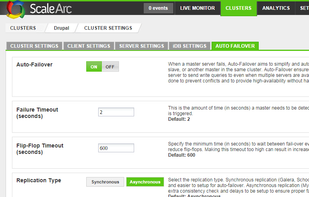
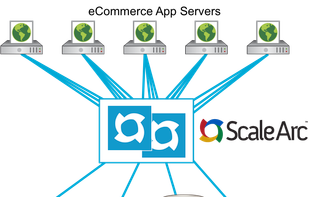
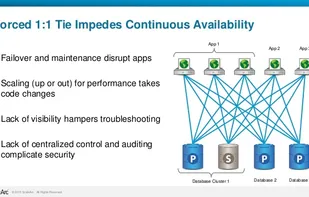
ScaleArc offers premium database load balancing software solutions that facilitate continuous availability between databases and applications for improved performance.
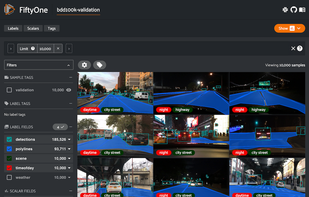
FiftyOne provides the building blocks for optimizing your dataset analysis pipeline, including visualizing complex labels, evaluating your models, exploring scenarios of interest, identifying failure modes, finding annotation mistakes, and much more!.
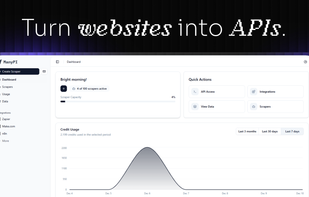
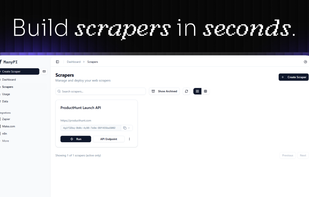
Convert any website into a clean, type-safe API. Use natural-language or JSON-schema prompts to extract data and get usable JSON output for RAG pipelines, sales, content aggregation, or research. Do it all within seconds.
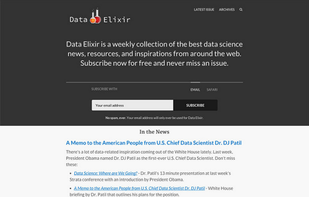
Data Elixir helps data scientists and engineers stay current with the latest news and technologies. We track down the best data-related news, resources, and inspirations from around the web each week and publish the collection as a free newsletter.
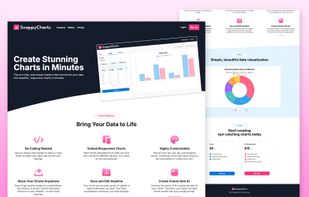
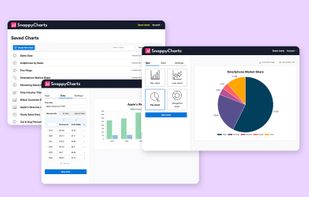
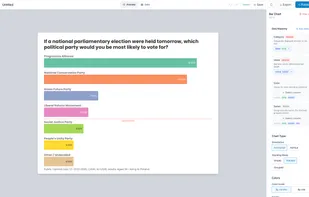
Create stunning, customizable charts online—no coding needed! Export as high-quality images or embed responsive, interactive charts on your website. AI-powered data generator included for pro accounts. Effortless data visualization for everyone!
Dataello is a data visualization tool that turns spreadsheets into stunning, interactive charts. Create professional visualizations in seconds — no design skills or coding required.