Apps with 'Data visualization' feature Page 21 of 27

All apps in Apps with 'Data visualization' feature category. Use the filters below to narrow down your search. 
Copy a direct link to this comment to your clipboard
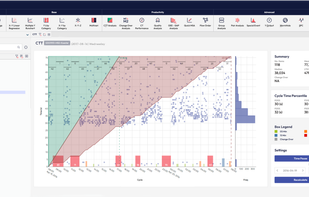
  1. Infotools Harmoni, is powerful market research analysis software, purpose-built for processing, analyzing, visualizing and sharing market research data.

    Cost / License

    • Paid
    • Proprietary

    Platforms

    • Software as a Service (SaaS)
    2 alternatives
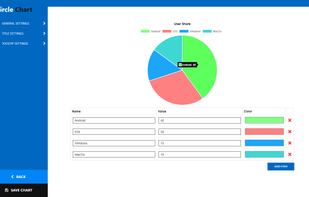
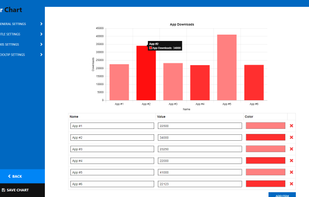
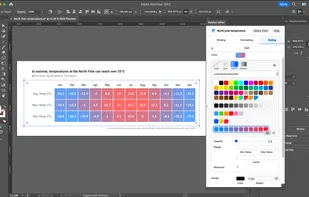
  2. ActiveChart is a free desktop app that lets you very easily create interactive or static charts. Select from 6 chart types from bar to pie charts, configure the settings and export as HTML or a static image.

    Cost / License

    • Free
    • Proprietary

    Platforms

    • Mac
    • Windows
    ActiveChart screenshot 1
    ActiveChart screenshot 1
    6 alternatives
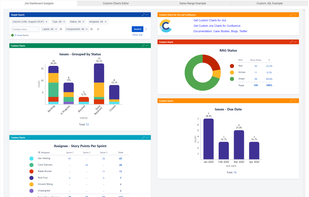
  3. We're a team of UK based Atlassian consultants dedicated to simplifying the Atlassian toolset for non-technical teams. As Atlassian tools such as Jira Service Desk and Confluence grow beyond the software development teams they were initially made for, many clients are...

    Cost / License

    • Paid
    • Proprietary

    Platforms

    • Online
    • Software as a Service (SaaS)
    Old Street Solutions screenshot 1
  4. GenView 3D is the ultimate business decision making software for executives to efficiently control, pilot and ensure alignment with business objectives.

    Cost / License

    • Paid
    • Proprietary

    Platforms

    • Mac
    • Windows
    • Linux
    • Android
    • iPhone
    • iPad
    Genview3d - Business Decision Making Software screenshot 1
    Genview3d - Business Decision Making Software screenshot 1
  5. Adioma icon
     Like

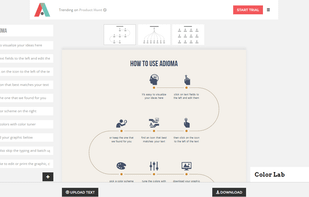
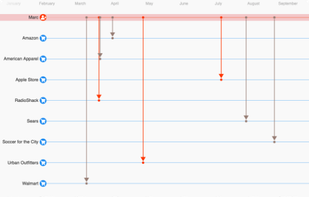
    Adioma creates information graphics out of your textual data, using timelines, grids and icons. Made by designers, it takes your information and automatically follows the rules of information design to present it clearly, and beautifully.

    Cost / License

    • Paid
    • Proprietary

    Platforms

    • Online
    Adioma screenshot 1
    13 alternatives
  6. KronoGraph is a JavaScript SDK for building browser-based, interactive, investigative timeline visualizations that reveal how events unfold.

    Cost / License

    • Paid
    • Proprietary

    Platforms

    • Mac
    • Windows
    • Linux
    • Online
    • Android
    • iPhone
    • Chrome OS
    • Android Tablet
    • iPad
    • Self-Hosted
    • Software as a Service (SaaS)
    Scalable visualization, from a few events to hundreds of thousands
    Build intuitive, interactive, customized timeline visualization tools
    Integrate seamlessly with Cambridge Intelligence's graph visualization toolkits
    +1
    Timeline visualizations that drive investigations
  7. DXchange provides an enterprise-grade cloud-native hybrid integration platform by connecting applications, data, devices both on-premises and in the cloud, enabling them to be digitally transformed.

    Cost / License

    • Freemium
    • Open Source

    Platforms

    • Windows
    • Linux
    • Online
    • Software as a Service (SaaS)
    DXchange.io screenshot 1
    DXchange.io screenshot 1
    5 alternatives
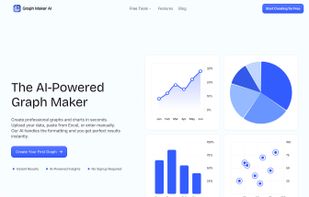
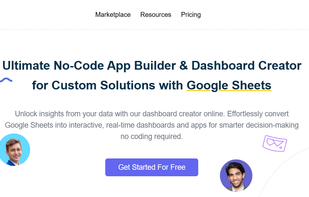
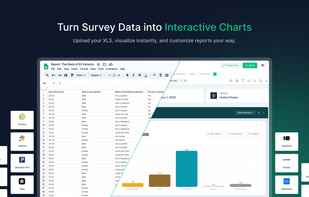
  8. Graph Maker helps you transform complex data into beautiful, professional visuals instantly. You can upload files, paste directly from Excel, or enter your data manually to get started. The platform uses AI to handle formatting automatically, ensuring you get perfect results for...

    Cost / License

    • Free
    • Proprietary

    Platforms

    • Online
    Graph Maker AI screenshot 1
  9. Datylon icon
     Like

    Datylon is a data visualization platform that enables the design, automation, and sharing of on-brand reports and charts.

    Cost / License

    • Paid
    • Proprietary

    Platforms

    • Mac
    • Windows
    • Online
    • Adobe Illustrator
    • Microsoft Excel
    • Microsoft PowerPoint
    Datylon for Illustrator editing chart in the report layout
    Datylon for Illustrator editing chart in the report layout
    Datylon for Illustrator editing infographics
    +1
    Datylon for Illustrator editing heatmap chart
  10. Zetta icon
     Like

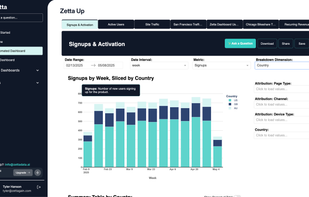
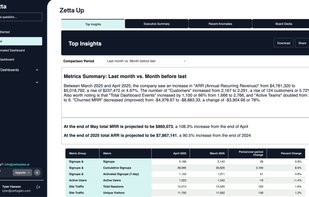
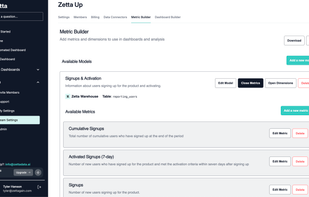
    At Zetta, we simplify data clarity for startups. Founded by data scientists from Loom (Atlassian), Shipt (Target), Flexport, Reverb, GoFundMe, and Tango, we understand the challenges of turning data into actionable insights.

    Cost / License

    • Free
    • Proprietary

    Platforms

    • Online
    • Software as a Service (SaaS)
    Zetta's default automated dashboard
    Zetta's automated insights landing page
    Zetta's metric builder
    8 alternatives
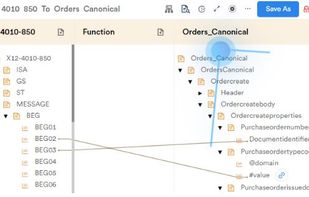
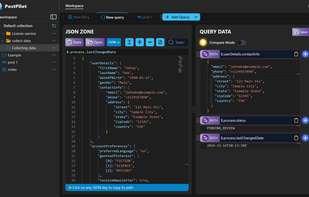
  11. Schema Visualizer is a collaboration platform for teams to visualize data schemas in JSON or Prisma and API schemas in Protobuf and GraphQL and generate graphs, ER-diagrams for real-time collaboration internally and externally.

    Cost / License

    • Paid
    • Proprietary

    Platforms

    • Online
    Schema Visualizer screenshot 1
    8 alternatives
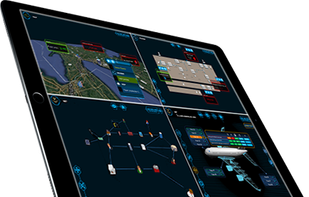
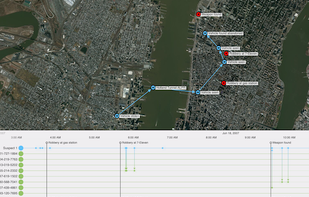
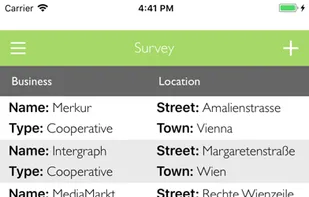
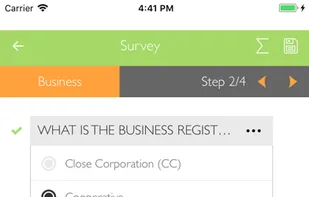
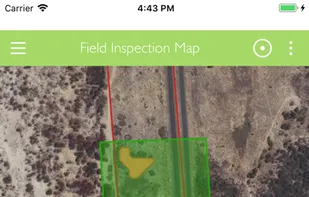
  12. M.App Enterprise Mobile App enables you to connect your mobile device to your M.App Enterprise on-premise installation. It provides you rich workflows to browse and modify your GIS data online and offline.

    Cost / License

    • Free
    • Proprietary

    Application types

    Platforms

    • Android
    • iPhone
    • iPad
    M.App Enterprise screenshot 1
    M.App Enterprise screenshot 1
    M.App Enterprise screenshot 2
    +5
    M.App Enterprise screenshot 3
    4 alternatives
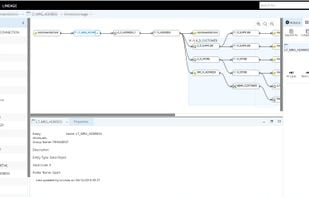
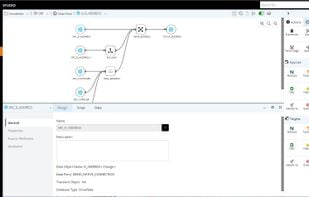
  13. A single enterprise class data integration solution that enables organizations to quickly and efficiently access diverse and emerging sources, streaming data or at rest, across traditional on-premise data platforms, cloud, or in hybrid environments.

    Cost / License

    • Paid
    • Proprietary

    Platforms

    • Online
    Diyotta 4.0 screenshot 1
    Diyotta 4.0 screenshot 1
    Diyotta 4.0 screenshot 2
    +4
    Diyotta 4.0 screenshot 3
    43 alternatives
  14. RTM Pro icon
     Like

    RTM Pro empowers your team to solve manufacturing issues faster. This in-database analytics platform helps you uncover root causes by simplifying complex data exploration. Identify trends, correlations, and key metrics to optimize production.

    Cost / License

    • Paid
    • Proprietary

    Platforms

    • Windows
    CPK Tool
    CTT Tool
    Group Analysis Tool
    +3
    Stats Tool
    4 alternatives
  15. Bold BI icon
     Like

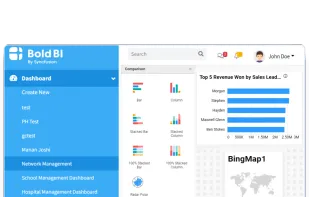
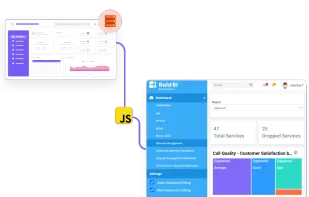
    Bold BI is a comprehensive embedded analytics platform designed to empower end users with data-driven decision-making capabilities. Our solution is tailored for a variety of use cases, enabling you to integrate powerful analytics directly into your business applications.

    Cost / License

    • Paid
    • Proprietary

    Platforms

    • Online
    • Self-Hosted
    • Software as a Service (SaaS)
    Application Overview
    Embedding Visualizations
    Designed for Embedding
    +9
    Easy to Use Designer
    33 alternatives
  16. ChartApps icon
     Like

    ChartApps is a No Code App Builder and Dashboard Creation Tool that Transforms your Google Sheets into Attractive Apps and Dashboards without Code.

    Cost / License

    • Freemium
    • Proprietary

    Platforms

    • Online
    ChartApps screenshot 1
  17. Techyons hub - Quick onboarding, find answers in seconds watch data turn into actionable insights for every team from startups to enterprises.

    Cost / License

    • Paid
    • Proprietary

    Platforms

    • Online
    • Software as a Service (SaaS)
    Techyons Hub was designed to eliminate this fragmentation completely. It acts as the digital
headquarters of your organization—a unified workplace that brings your people, identity, data,
productivity tools, collaboration channels, and AI-powered assistance into one powerful ecosystem.
    The Admin Center functions as a command control panel a place where leaders can oversee the
entire workforce structure from one unified view. Admins can see real-time counts of Managers, IT
Admins, Developers, Testers, Business Teams, and Guests. Every identity and permission becomes fully
transparent.
    Performance analytics reveal team output by user, department, and project, helping identify early
risks, workload imbalances, and improvements needed across the organization.
This means decisions become data-driven rather than assumption-driven.
    +1
    With the AI chatbot available at every step, employees save hours each week.
It reduces writing workload, accelerates tasks, and supports remote and hybrid teams with always-
available intelligence. They need intelligent support—
something that can summarize files, draft documents, answer questions, and accelerate everyday tasks.
The Techyons AI Chatbot is built exactly for this purpose.
  18. Grafieks icon
     Like

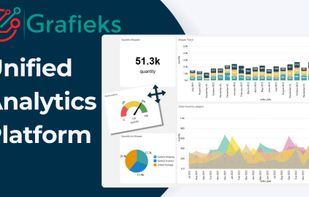
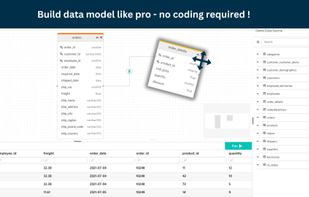
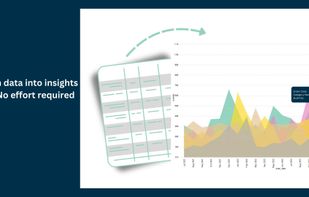
    Grafieks is a user-friendly unified analytics platform that lets you explore real-time and historical data effortlessly. With Grafieks, you can easily connect to your data sources, create custom models, and generate detailed reports with ease.

    Cost / License

    • Freemium
    • Proprietary

    Platforms

    • Software as a Service (SaaS)
    • Online
    Grafieks screenshot 1
    Grafieks screenshot 1
    Grafieks screenshot 2
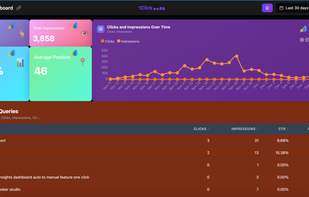
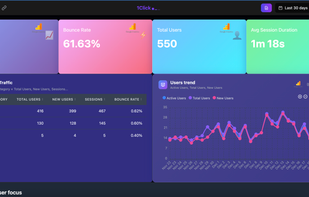
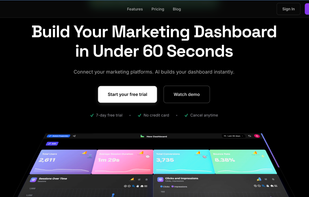
  19. AI-powered marketing analytics platform. Get instant dashboards and ask Claude AI questions about your GA4, Google Ads, Meta Ads & Search Console data.

    Cost / License

    • Paid
    • Proprietary

    Platforms

    • Online
    • Software as a Service (SaaS)
    1 Click Report screenshot 1
    1 Click Report screenshot 1
    1 Click Report screenshot 2
    4 alternatives
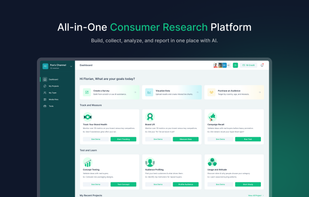
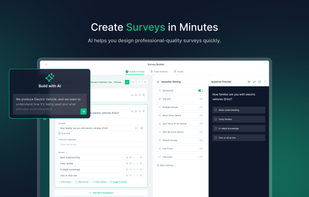
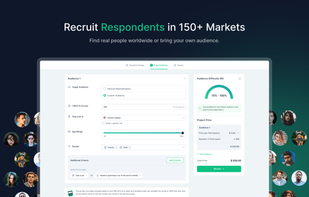
  20. Standard Insights is an AI-powered consumer research platform that makes surveys simple, fast, and powerful. Design, collect, analyze, and report in minutes, so you can understand your audience, grow your brand, and launch with confidence.

    Cost / License

    • Freemium
    • Proprietary

    Application type

    Platforms

    • Online
    • Software as a Service (SaaS)
    Build, collect, analyze, and report data in one place with AI-powered workflows and global reach.
    AI-powered builder helps you design professional-quality surveys with logic, branching, and translations.
    Find real consumer panels worldwide or invite your own audience with simple links and targeting.
    +3
    Import XLS or survey files, instantly create visual charts, and customize dynamic reports your way.
    26 alternatives
  21. PostPilot icon
     Like

    All-in-One Workspace for API Testing, Database Queries, and Data Inspection.

    Cost / License

    • Freemium
    • Proprietary

    Platforms

    • Online
    PostPilot screenshot 1
    PostPilot screenshot 1
    PostPilot screenshot 2
    +2
    PostPilot screenshot 3
    9 alternatives
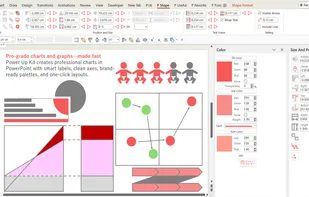
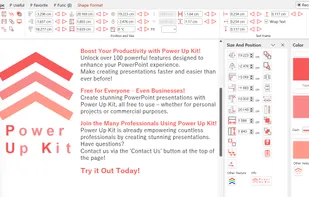
  22. PowerUpKit is a free Microsoft PowerPoint add-in (PPAM) for Windows that delivers more than 100 productivity Features to accelerate everyday slide design and maintenance. It focuses on the repetitive actions consultants, analysts, instructors, and creators perform dozens of...

    Cost / License

    • Free
    • Proprietary

    Platforms

    • Windows
    • Microsoft PowerPoint
    • Microsoft 365 (Office)
    • Microsoft 365
    Pro-grade charts and graphs—made fast.
Power Up Kit creates professional charts in PowerPoint with smart labels, clean axes, brand-ready palettes, and one-click layouts.
    Free PowerPoint add-in for Windows with 100+ Features: align, resize, clean up.
    6 alternatives
  23. Kenelyze icon
     Like

    Kenelyze is a visual analytics platform which allows anyone to create fully interactive network maps on the fly using any dataset.

    Cost / License

    • Paid
    • Proprietary

    Application type

    Platforms

    • Software as a Service (SaaS)
    Kenelyze screenshot 1
    Kenelyze screenshot 1
    Kenelyze screenshot 2
    9 alternatives