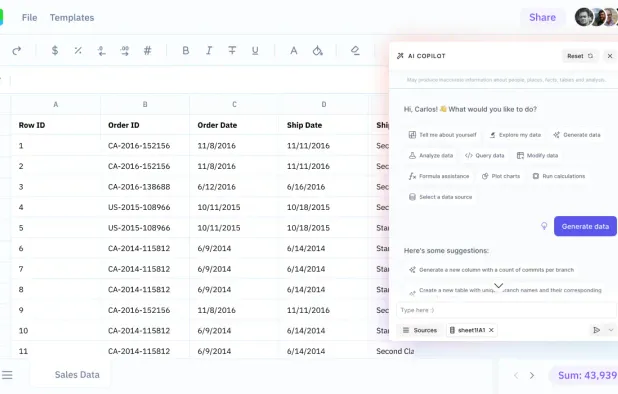
Easy to use business intelligence platform built for company wide collaboration. Business user friendly. Any data source and an unlimited amount of data.
DataSciencePR is the global leader in the press release distribution and the digital marketing services for data science, machine learning & AI, big data, data visualization, blockchain, and technology fields.
A Cloud Platform for Data Science and Big Data Analytics
Collaborate on, scale, and deploy data analysis and advanced analytics projects radically faster. Use the most powerful tools — R, Python, JavaScript, Redshift, Hive, Impala, Hadoop, and more — supercharged and integrated i.
Run your code faster, without the infrastructure hassle
Domino makes it easy to run your Python, R, MATLAB, and Julia code on more powerful hardware with one command, so you can get your results faster. Customers tell us these features can reduce set-up and configuration times b.
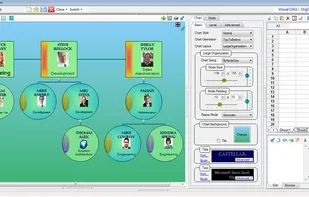
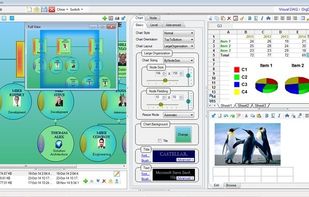
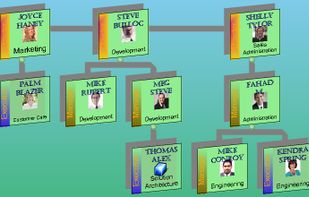
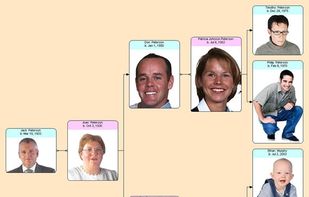
OrgDoc is a unique desktop-based Organization Chart Creator & Data Organizer software. This data management software can be used for creating organization/hierarchy charts, and also as your organizational as well as personal data manager (Data Visualizer) and file organizer.
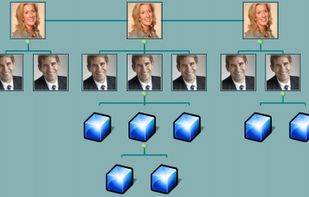
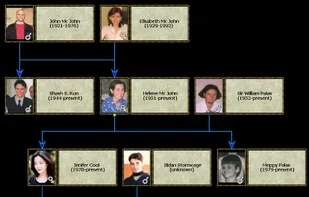
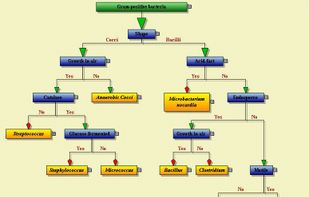
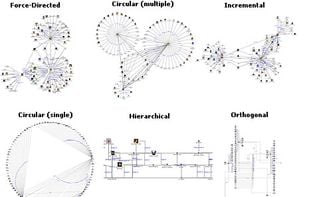
The perfect graph drawing library to build a complicated diagram, present an algorithm, build a hierarchy or define a genealogy tree and for much more.
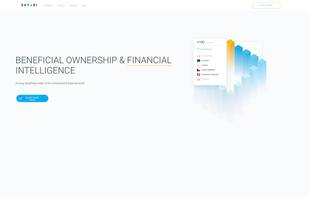
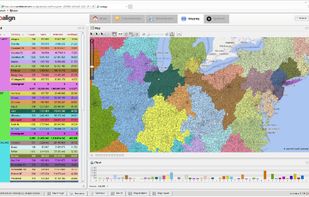
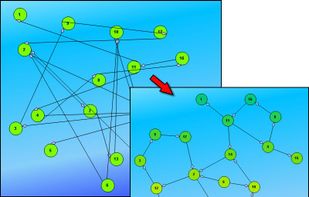
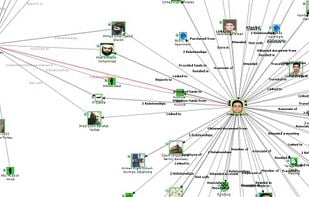
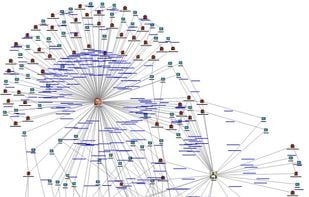
Empowering the demanding needs of intelligence analysts, law enforcement, investigators, researchers, and information workers, Sentinel Visualizer is the next generation data visualization and analysis solution for your big data.
Datameer is a business-user-focused business intelligence (BI) platform for Hadoop. But Datameer doesn't treat Hadoop as an island of information; it can connect to any data source through JDBC, Hive, HTTP, or other standards.
OpenSpending.org aims to track every government & corporate financial transaction across the world. Does so by providing a open source data visualization software for the web.
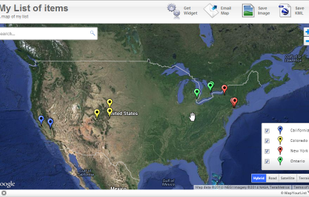
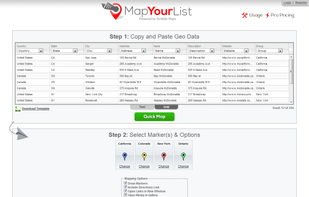
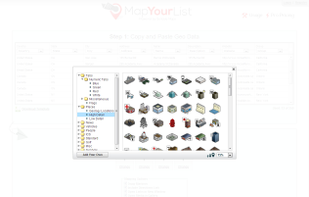
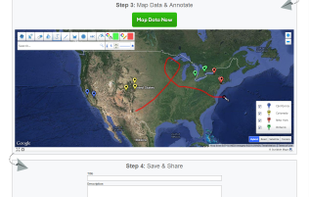
Quick and easy Custom Maps for Mobile, Tablet, and Computers - Use a list of addresses, coordinates, or other location data to quickly & easily make maps. Basic and advanced maps to produce custom filters.
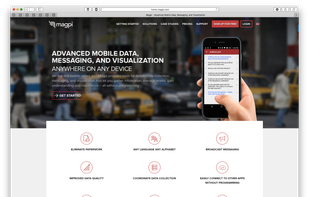
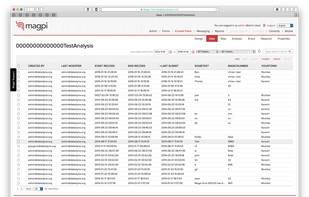
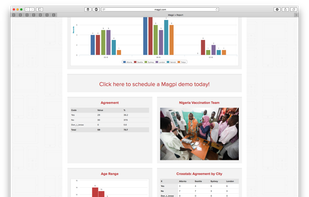
Magpi mobile technology makes data collection, collaboration and communication in the field easy and affordable. From nonprofits to oil and gas inspectors, Magpi is recognized as a proven leader and pioneer in mobile data collection, messaging, and data visualization with more...
Visualizing.org is a community of creative people making sense of complex issues through data and design... and a shared space and free resource to help you achieve this goal.
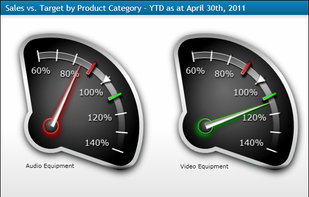
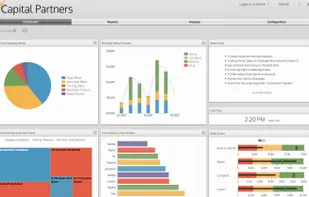
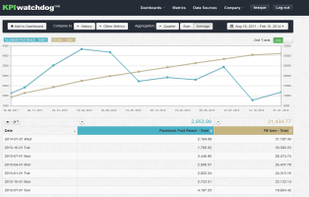
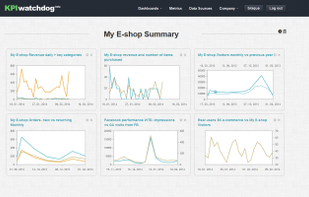
Dundas Dashboard is flexible, powerful dashboard software lets you quickly create business and performance dashboards. Visualize your data & take action!
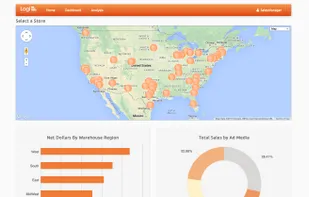
Logi Info is a rapid development platform that delivers a full range of powerful and interactive dashboards, reports and self-service analytic capabilities. Info creates engaging experiences that can be deployed to the broadest range of users within the applications they’re...
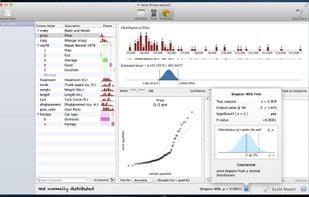
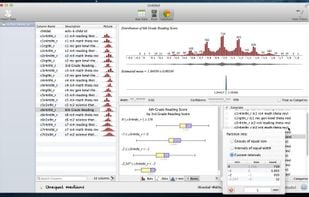
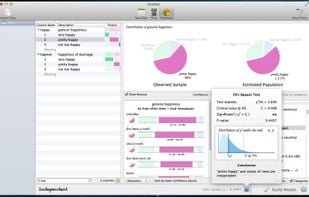
Wizard is a new Mac app that makes data analysis easier than ever. No programming, no typing — just click and explore. Wizard includes a full set of tools for doing professional research, yet its friendly interface makes statistics accessible to beginners.
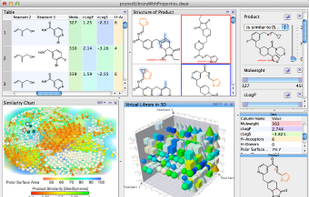
DataWarrior combines dynamic graphical views and interactive row filtering with chemical intelligence. Scatter plots, box plots, bar charts and pie charts not only visualize numerical or category data, but also show trends of multiple scaffolds or compound substitution patterns.
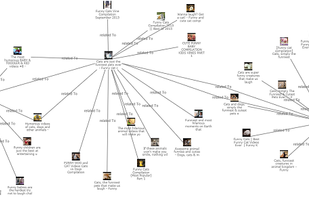
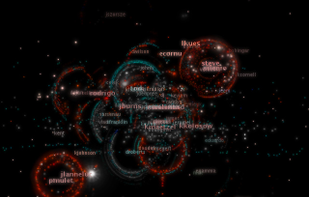
code_swarm shows the history of commits in a software project. A commit happens when a developer makes changes to the code or documents and transfers them into the central project repository. Both developers and files are represented as moving elements.
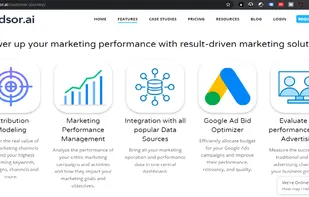
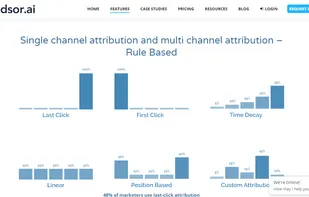
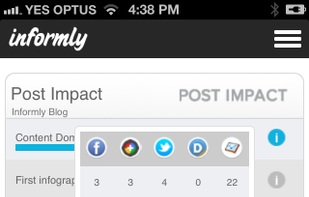
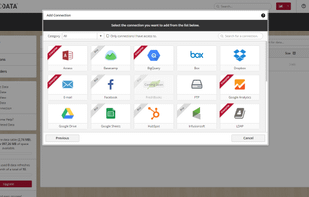
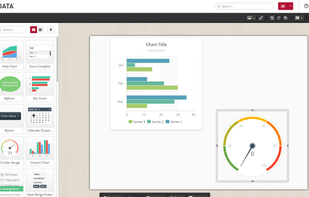
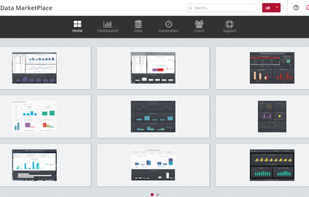
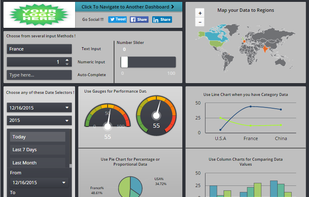
Transform data into information through powerful interactive dashboards so you can visualize performance, forecasts and results with the right indicators. Your data doesn't even have to be perfect: we give you the tools to clean it and structure it.