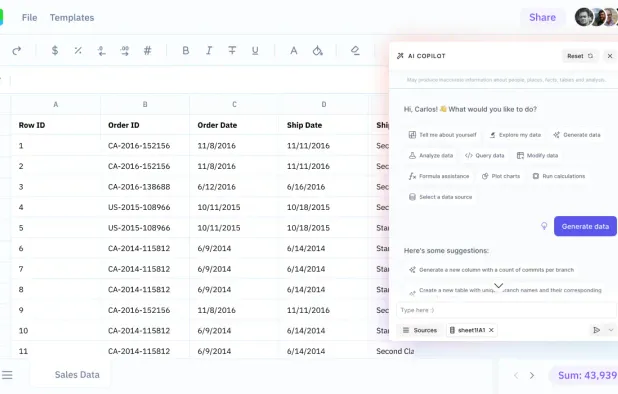
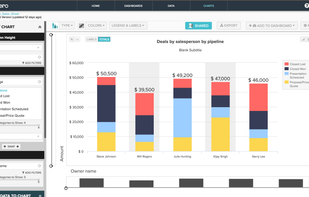
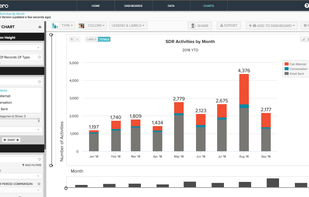
bipp is an enterprise-grade cloud, business intelligence platform. We help data analysts create faster queries & deliver sharper insights.
Cost / License
- Free
- Proprietary
Application type
Platforms
- Software as a Service (SaaS)
bipp is an enterprise-grade cloud, business intelligence platform. We help data analysts create faster queries & deliver sharper insights.
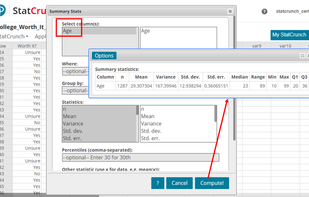
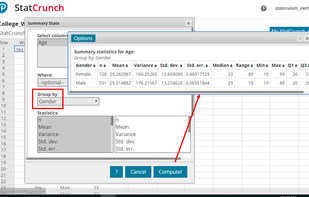
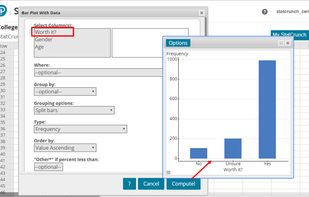
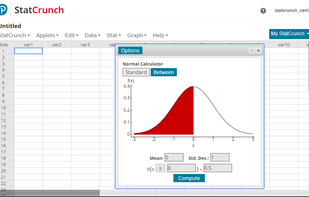
StatCrunch is a Web-based statistical software package for analyzing data. StatCrunch works on any desktop browser, such as Chrome, Firefox, Internet Explorer or Safari. StatCrunch also works with Web browsers on smartphones or tablets running iOS, Android and other mobile...
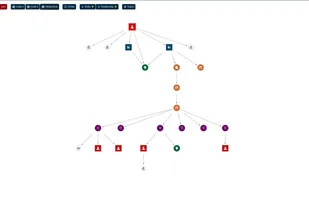
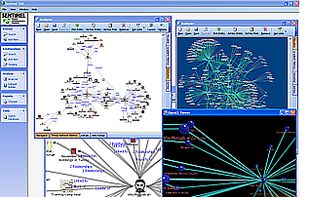
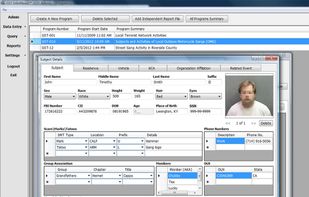
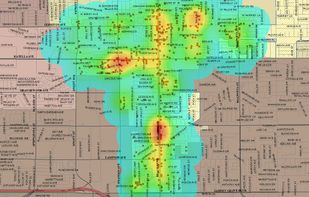
Affordable yet powerful, Crime Tech Solutions' Link Analysis software is the only true alternative. Pound for pound, the most robust link analysis product available today.
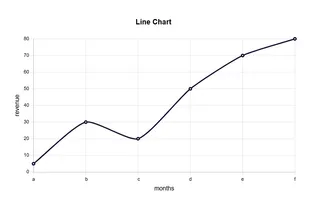
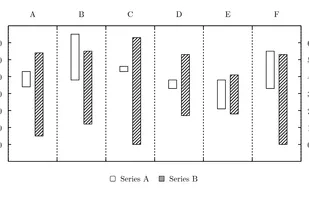
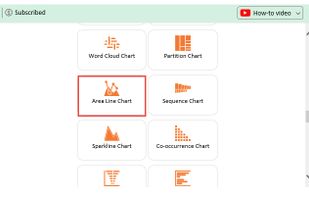
Create a line graph with easy to use tools and download the line graph as jpg, png or svg file. Customize line graph according to your choice.
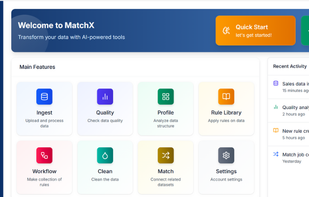
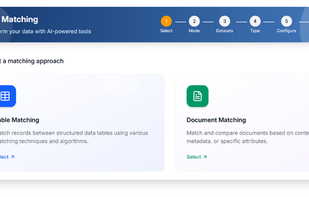
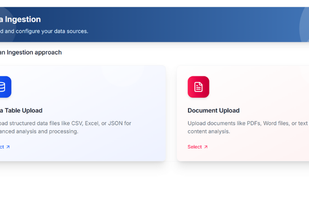
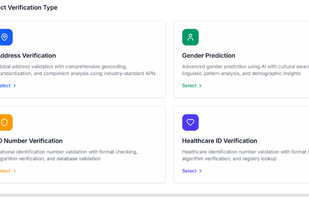
MatchX is an AI-powered platform that automates data quality management and intelligent matching for both structured data and documents enabling faster, more accurate decisions across industries.
Create charts and diagrams from the command line. Contribute to asmuth/clip development by creating an account on GitHub.
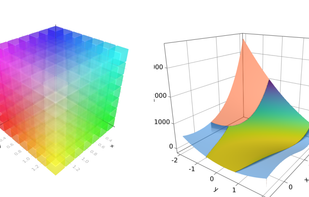
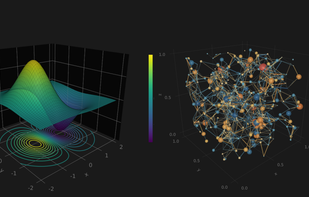
Makie is a high-performance, extendable, and multi-platform plotting ecosystem for the Julia programming language. For more examples go to the different menu sections. And the official documentation.
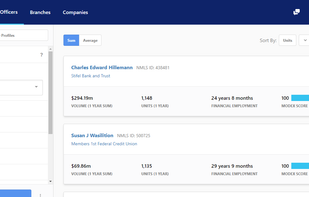
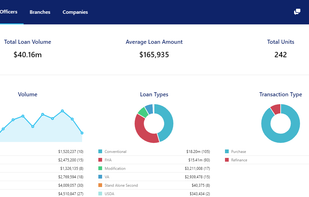
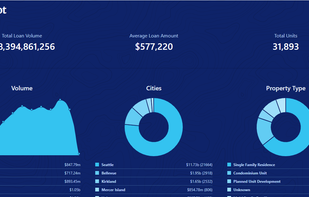
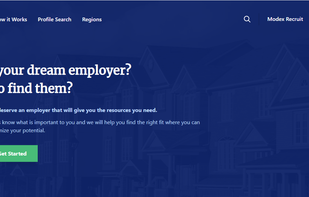
Modex makes mortgage recruiting easy and transparent. Research, find, and communicate with loan officers, branches, and companies.
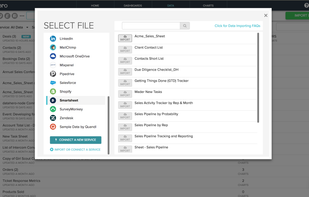
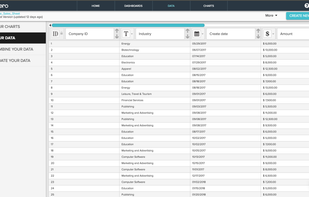
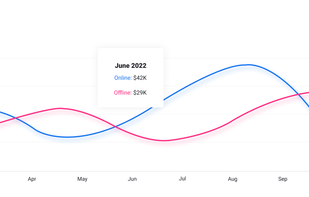
The fastest, easiest way to get insights from your data. DataHero allows you to create charts, reports, and dashboards that you can easily share with teams and clients.
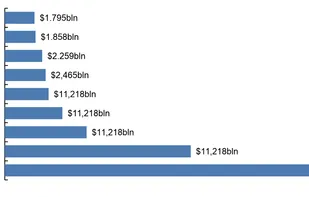
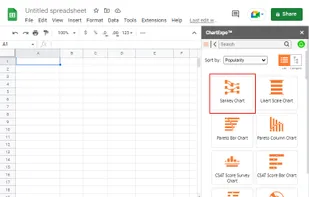
ChartExpo is an online charting tool designed for all users. There is no coding or technical skills required.
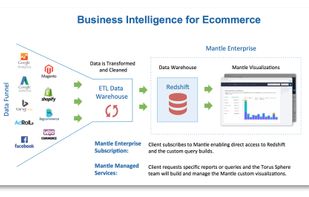
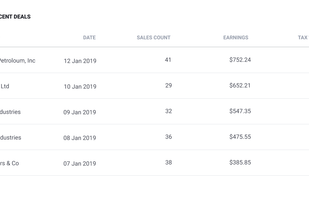
Data visualization tool for enterprise-level e-commece metrics. Get business intelligence insights quickly and easily.
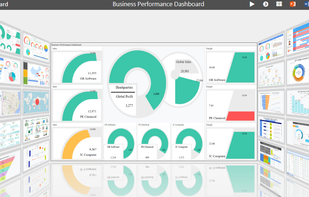
Smart eVision Dashboard empowers all users with actionable insights from enterprise data. View your insights on our unique dashboard presenter: the Cockpit, which can be exported as interactive PPT files for you to take on the go.
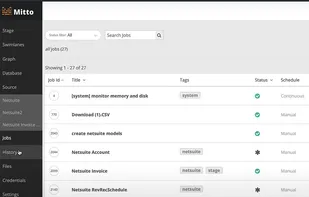
Zuar provides cutting-edge data tools: Mitto ETL automation, data transformation/modeling, Tableau enhancements, and seasoned engineers to help with deployments.
TeeBI is a component suite to help developers provide integrated and easily useable data analysis services in their own developed applications. Support for Embarcadero RAD Studio, Delphi and C++, VCL and FireMonkey frameworks.
Let your Google Analytics reports speak up. Supercharge your business with well-designed and easy-to-use reports from Google Analytics in a few clicks. Get it for FREE!.

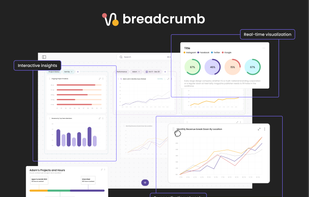
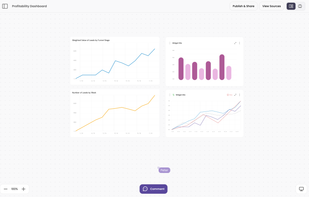
Breadcrumb.ai empowers individuals to interact with and utilize data effectively. Transforming data into interactive dashboards, reports, and presentations can be done in minutes. Conduct intricate analyses, merge various data sources, produce captivating data visualizations...
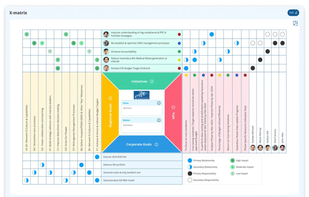
A Balanced Scorecard solution enabling organisations across industries to visualise goals, align teams, and track performance using powerful dashboards, strategy maps, and real-time analytics.
Grunt is the ultimate add-in for anyone working with presentations or reports in PowerPoint. Create charts and other visualizations in no time. Connect to data in Excel. Adapt our wide range of dynamic templates to your needs.
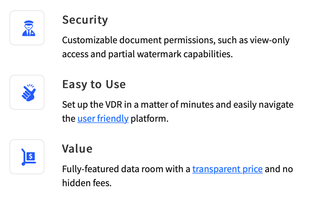
FirmRoom is a cloud-based virtual data room designed primarily for the financial sector. The solution helps organizations to manage mergers and acquisitions due diligence through document management and file sharing.


sleepgene is an app designed to help you track your dreams, emotions, and anxieties, providing support for both mental health and improved sleep. At night, you can log not only the dreams you hope to experience but also the worries or stressors that are weighing on you.


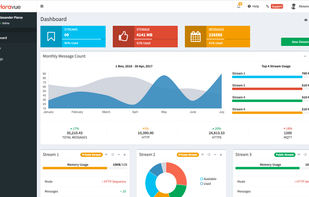
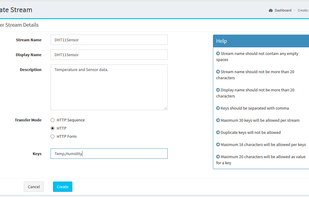
Horavue is a cloud based IoT visualization software from LogFuze that allows you to store, view and analyze your IoT data, thus paving way for creating innovative solutions and provide analytics.
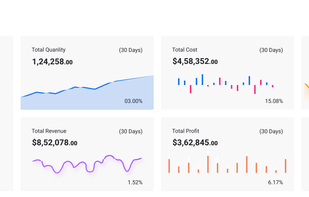
Revenyze is a B2B revenue intelligence platform aimed to help middle-sized businesses ?reate a single source of truth for all revenue-related data and immediately get powerful dashboards to reveal hidden insights without the need for a dedicated data analyst.
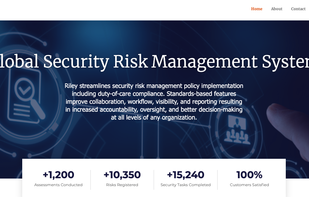
Riley is an intelligent, powerful, cost-effective, and easy-to-use enterprise security management platform.
Osintracker is focused on OSINT investigations. It's a source-oriented application, primarily focused on keeping track of your online findings.