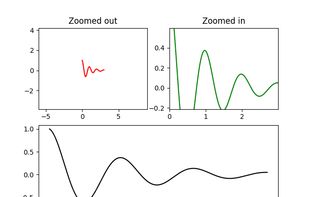
Matplotlib is a comprehensive library for creating static, animated, and interactive visualizations in Python. Matplotlib makes easy things easy and hard things possible.
Cost / License
- Freemium
- Open Source
Since
- Since 2010
 United States


+1


Apps similar to clip include Matplotlib, which is open source with a free version. Other options are GnuPlot, LabPlot, Grapher and DataGraph. You can choose from more than 10 Numerical Computation Software apps like clip for Mac, Windows and Linux.
Matplotlib is a comprehensive library for creating static, animated, and interactive visualizations in Python. Matplotlib makes easy things easy and hard things possible.
United States
Gnuplot is a portable command-line driven interactive data and function plotting utility. It was originally intended as to allow scientists and students to visualize mathematical functions and data. It does this job pretty well, but has grown to support many non-interactive...


LabPlot is a free, open source and cross-platform Data Visualization and Analysis software accessible to everyone and trusted by professionals.
 Germany
 EU


With Grapher, you can graph equations and data sets and visualize the results on your Mac in real time. Grapher displays algebraic relations, both implicit and explicit, in 2D and 3D. You can use a variety of coordinate systems and choose from a wide array of mathematical...
United States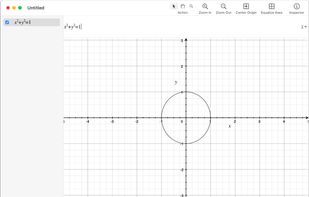


DataGraph is a simple and powerful graphing application for Mac OS X. It is a great companion for Excel, Numbers or any of the big statistical packages.
United States


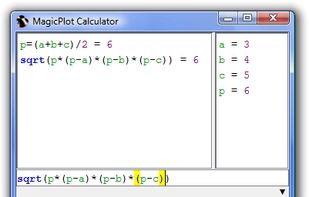
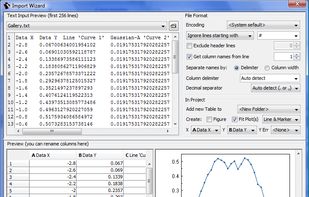
MagicPlot is cross-platform application for scientific and engineering plotting, non-linear and multipeak curve fitting and batch processing. MagicPlot produces high-quality plots and offers handy plot navigation. Project files have .mppz extention.
United States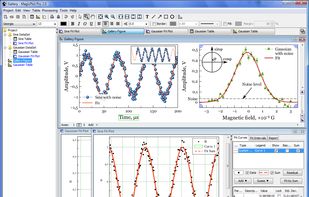



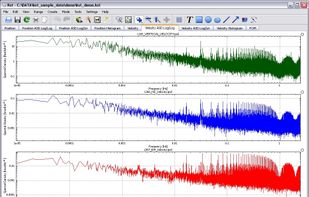
Kst is a fast, real-time large-dataset viewing and plotting tool available and has built-in data analysis functionality.

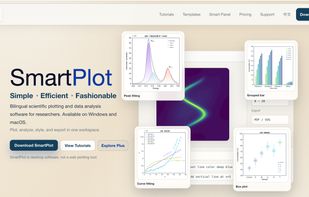
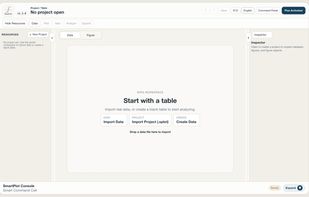
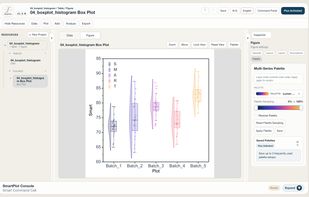
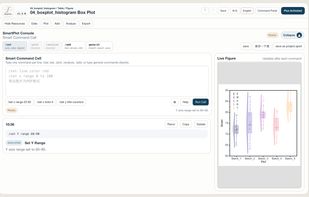
SmartPlot is a desktop scientific plotting and data analysis application designed for researchers who want a direct workflow from data tables to editable, publication-ready figures.
 Hong Kong


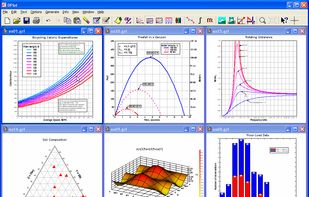
DPlot graphing software lets scientists and engineers graph, plot, analyze, and manipulate data.