


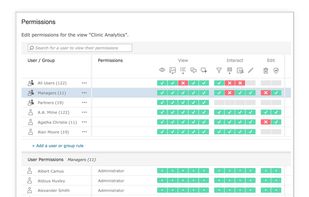
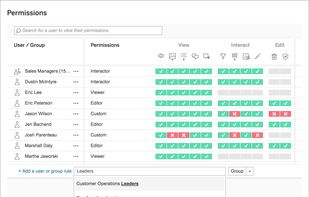
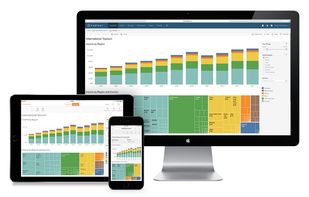
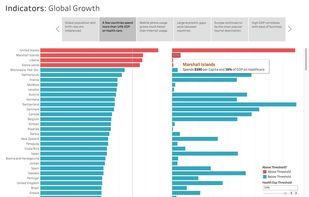
Tableau helps the world’s largest organizations unleash the power of their most valuable assets: their data and their people.
Cost / License
- Freemium
- Proprietary
Application type
Platforms
- Mac
- Windows
- Online
- Self-Hosted
 United States



+9


Sites and apps similar to Progress OpenEdge include Tableau, which has a free version. Other options are Google Charts, Zoho Analytics, QlikView and Teradata. You can choose from more than 10 Business Intelligence Tools like Progress OpenEdge for Windows, self-hosting, iPhone, Mac and Chrome OS.
Tableau helps the world’s largest organizations unleash the power of their most valuable assets: their data and their people.
United States
The Google Charts is an extremely simple tool that lets you easily create a chart from some data and embed it in a webpage. You embed the data and formatting parameters in an HTTP request, and Google returns a PNG image of the chart.
United States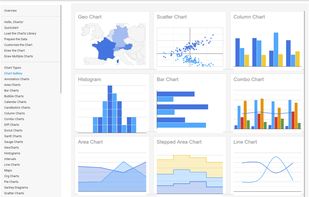


Create insightful reports & dashboards, Visually analyze your business information. Easily create insightful reports & dashboards using a drag and drop interface. No IT help required.
 India
India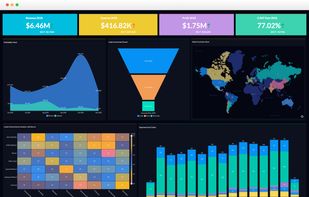


QlikView is Qlik’s classic analytics solution for rapidly developing highly-interactive guided analytics applications and dashboards, delivering insight to solve business challenges.
 Sweden
 EU
EU
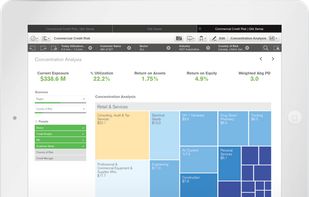
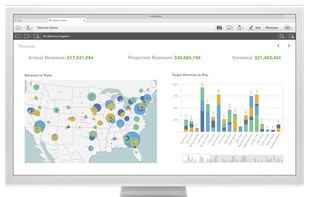


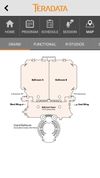
Teradata Corporation (NYSE: TDC) is a global leader in analytic data platforms, marketing and analytic applications, and consulting services, helps organizations become more competitive by increasing the value of their data and customer relationships.
United States



Gain insights and make informed decisions by letting you consolidate, visualize, and share your business's key metrics.
United States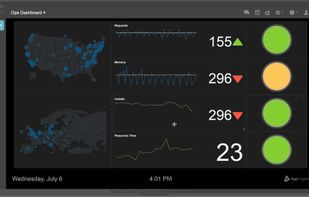


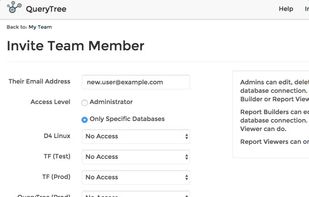
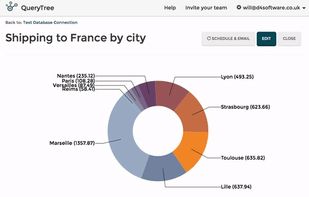
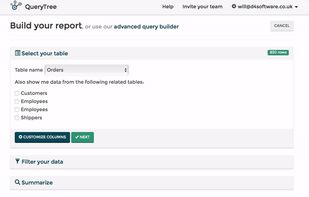
QueryTree is a flexible and powerful database reporting tool. Simply connect your database and start visualizing your data in minutes. Everything works with a dropdown menu interface - no code or SQL needed.
 United Kingdom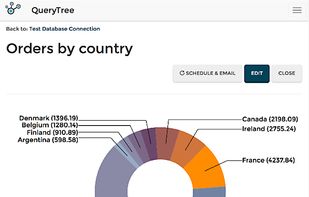


Looker gives you access to your organization’s data. Many users start by browsing through the reports - which we call “Looks” - and dashboards that others in their organization have already created. This page will show you how to get started browsing.
United States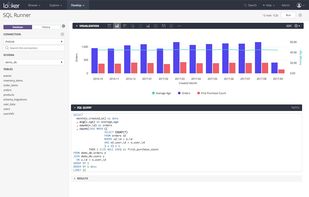


An Alternative to Google Image Charts that enables developers and marketers to embed personalized charts in their emails, Slackbots, web/mobile apps, and more.


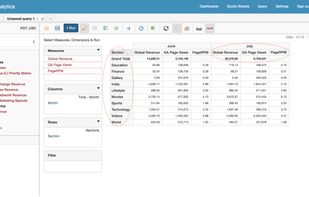
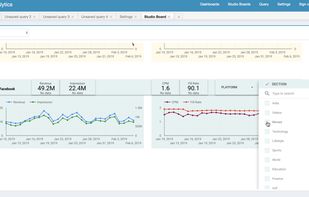
Tercept automatically aggregates and organizes all monetization data,analytics data and marketing data into one single dashboard with powerful querying and visualization capabilities. You can setup custom reports and automate 100% of your reporting.
India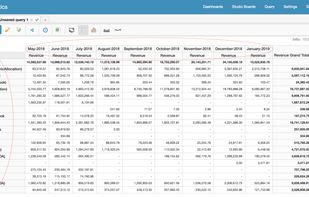



An intuitive Artificial Intelligence-powered business analytics software that uses aesthetically beautiful graphics to help translate raw data into company value.
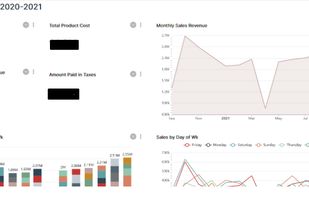
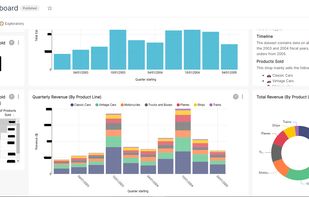
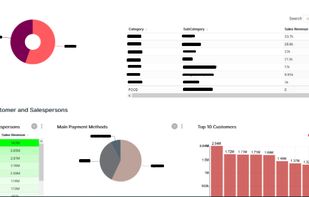


bipp is an enterprise-grade cloud, business intelligence platform. We help data analysts create faster queries & deliver sharper insights.


