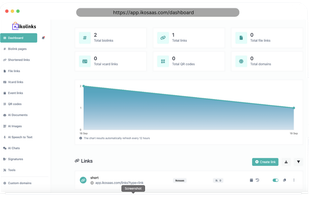
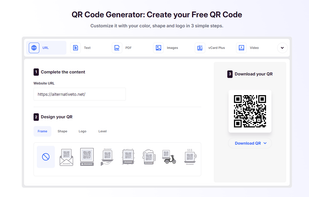
Dynamic QR code creation with scan analytics, customizable styles, advanced types for locations, vCards, WiFi, team roles, robust data privacy and visitor tracking.
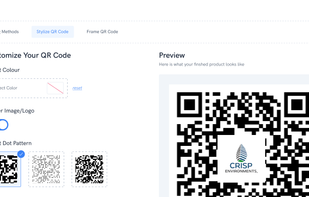
Dynamic QR code creation with scan analytics, customizable styles, advanced types for locations, vCards, WiFi, team roles, robust data privacy and visitor tracking.
Explore a world of curated content, helpful resources, and exciting updates. Sign Up below to discover more about Bio Links Tool. Do everything with one platform.
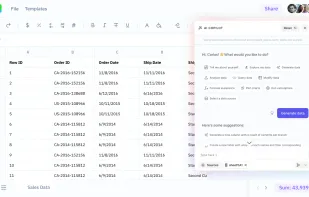
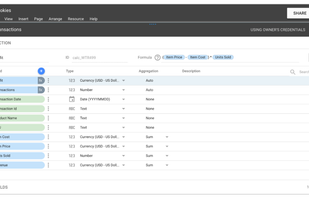
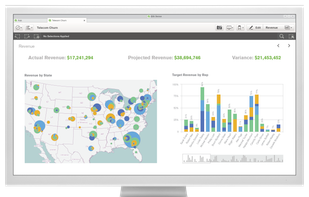
Spreadsheet interface integrates with databases and business apps, enabling data access, visualization, and reporting for users across multiple roles.
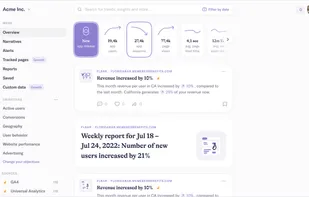
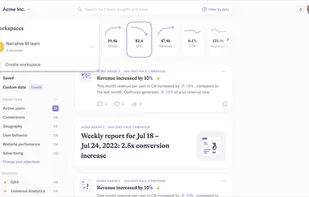
Narrative BI is an all-in-one marketing analytics and reporting platform for growth, marketing, sales, and product teams in every company, including agencies. It automatically generates insights from marketing channels and turns them into reports (narratives).
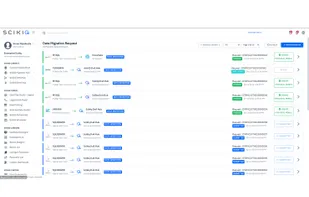
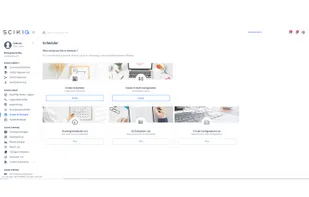
SCIKIQ is the next-generation data management platform for data-driven organizations, leveraging AI/ML to empower teams with real-time insights, centralized data sources.
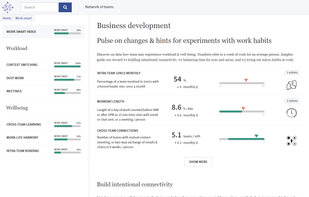
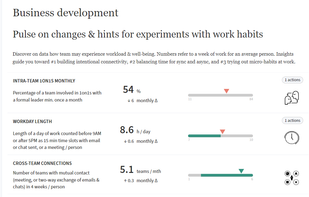
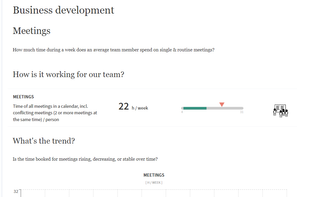
Network Perspective is an analytical software giving leaders data with actionable insights about teams' collaboration habits to decrease workload and boost well-being in the new reality.
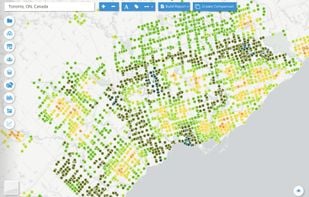
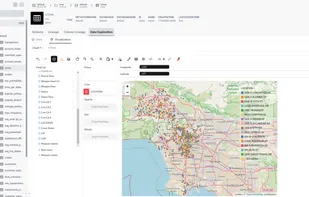
PiinPoint helps scaling brands to make informed decisions about what markets to go to next and why. Our leading GIS analytics platform centralizes your real estate planning workflow for site selection, real estate approvals, network performance forecasting and store operations...

Flywheel helps B2B SaaS companies convert free users to paying customers. Discover which marketing campaigns and tactics drive product adoption in minutes.
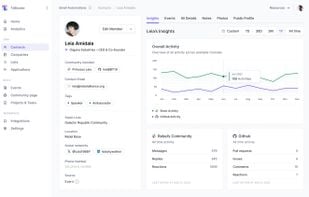
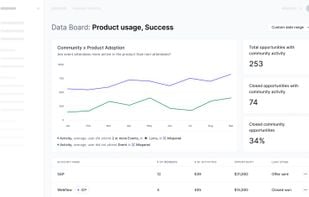
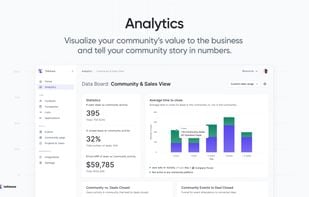
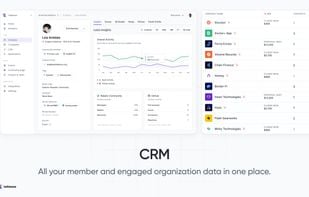
Talkbase transforms community activity into actionable analytics. Discover how each interaction boosts business metrics, from sales to customer satisfaction, and fuel your growth with insights that matter.
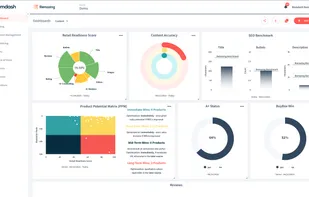
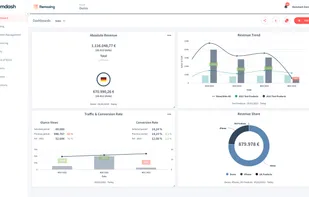
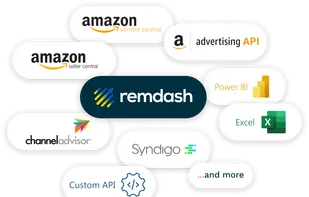
Remdash is a tool for vendors and sellers on Amazon with a focus on content, monitoring and reporting. The software solution saves valuable time thanks to automations and helps increase sales on Amazon with data-driven analyses.
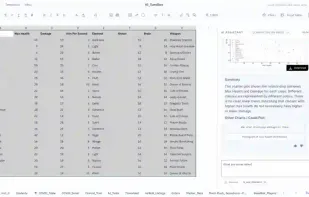
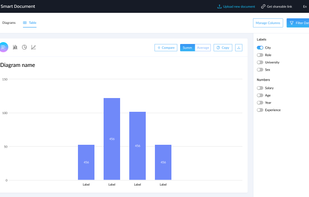
Smart Documents helps to understand the data without training. Just upload your table in "XLS" or "CSV" formats, filter the data and build a visualization.
No more spreadsheets and presentations. Fathom does the hard work of analysis, so you L&D professionals can focus on delivering high quality learning that has an impact.
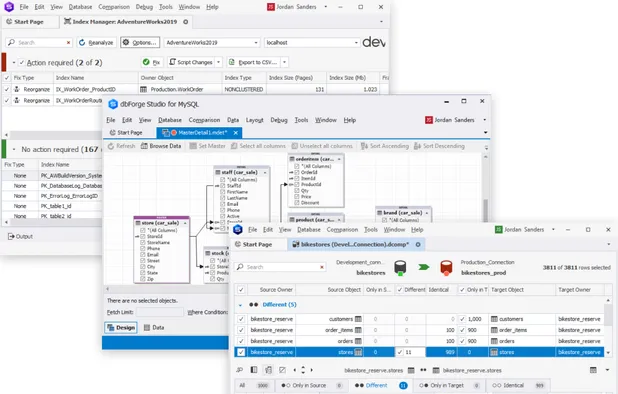
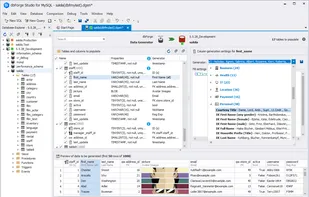
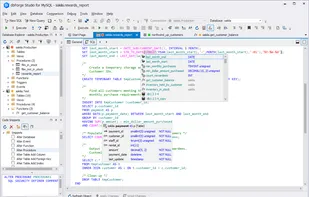
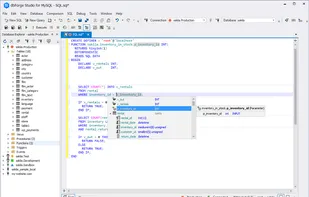
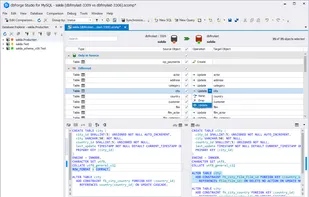
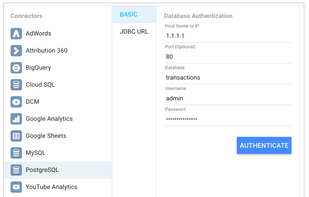
dbForge Studio for MySQL is the universal MySQL and MariaDB client for database management, administration and development. With the help of this intelligent MySQL client the work with data and code has become easier and more convenient.
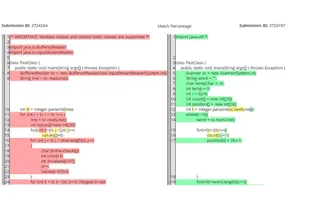
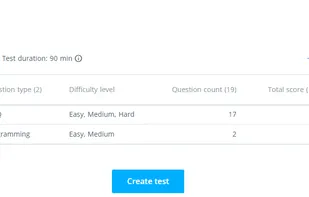
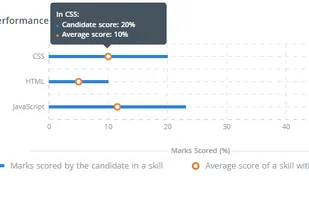
HackerEarth is the most comprehensive developer assessment software that helps companies to accurately measure the skills of developers during the recruiting process.
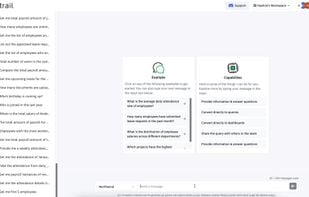
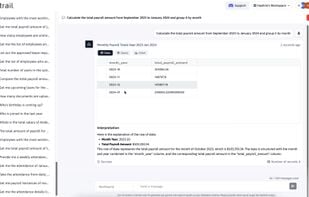
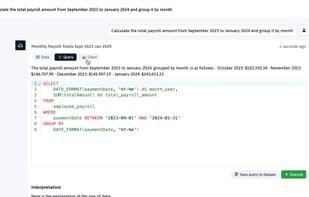
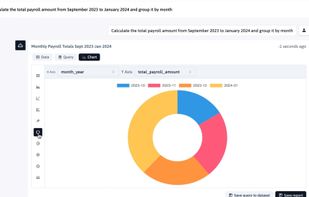
Flowtrail AI a Conversational AI analyst who will generate reports for you through a conversation with your data. Easily create insightful reports and dashboards from multiple databases, without the need for SQL expertise.
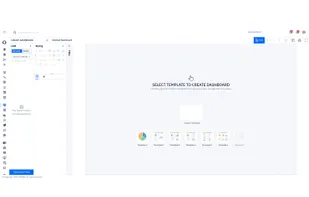
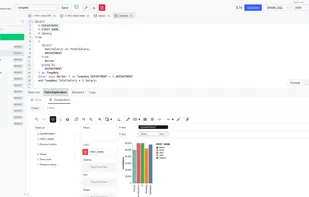
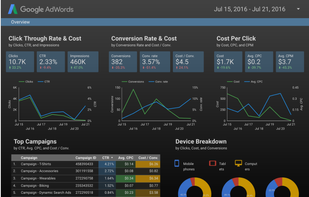
Data visualization and business intelligence (BI) platform for aggregating, sharing, collaborating, and pulling insights from raw databases, as well as built-in connections to Google products.
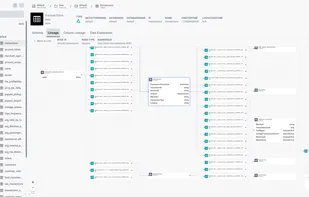
Stop developing your admin panel and focus on growing the actual product. The fastest and easiest way to bootstrap internal tools for your business. An open-source, no-code admin panel to manage your data, perform custom actions, build reports and dashboards.
QlikView is Qlik’s classic analytics solution for rapidly developing highly-interactive guided analytics applications and dashboards, delivering insight to solve business challenges.


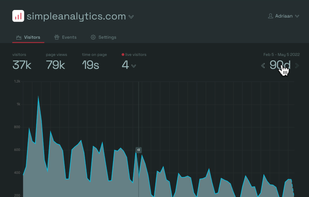
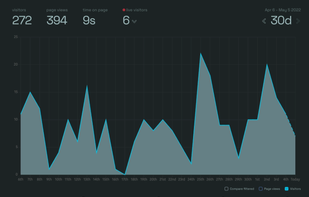
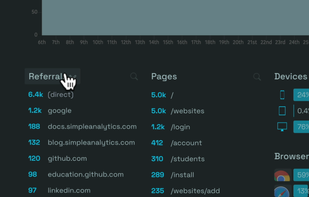
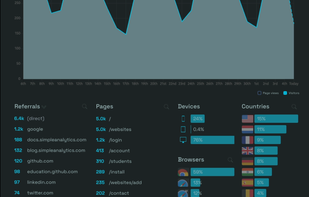
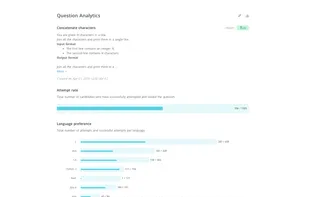
Simple Analytics is a web analytics tool that places a strong emphasis on privacy protection. It is designed to comply with various privacy policies such as the GDPR, PECR, and CCPA. A key feature of Simple Analytics is that it does not store any personal data about website...