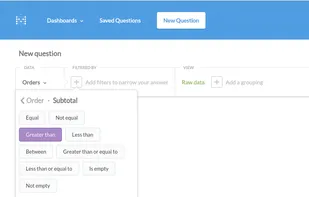
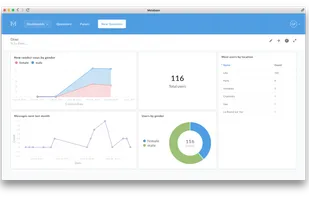
Metabase is a simple and powerful analytics tool which lets anyone learn and make decisions from their company’s data. No technical knowledge required! We hope you love it.
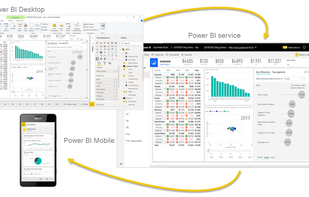
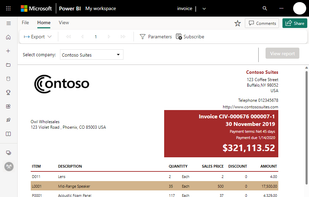
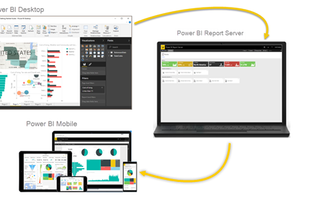
Enhance your decision-making by transforming diverse data sources into engaging, interactive visual insights with tools like Power BI Desktop and a web service.
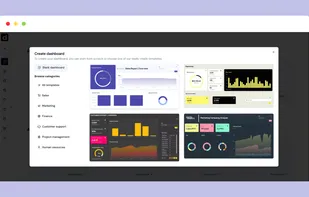
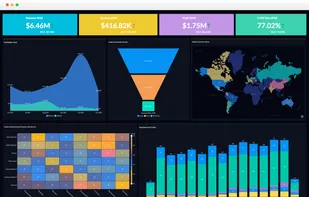
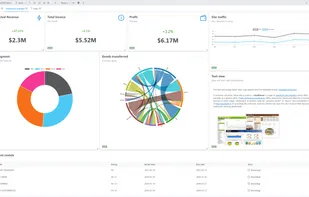
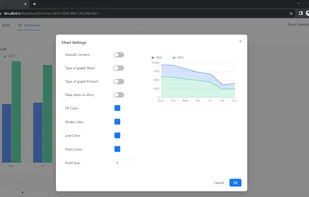
Dashbreeze is a powerful yet user-friendly dashboard-building platform designed to simplify data visualization and empower users to make informed decisions.
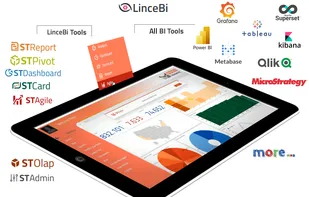
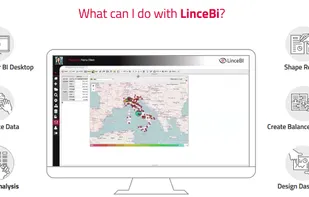
The most complete OpenSource Bussines Intelligence platform including BI Portal, Reports, OLAP Analysis, Dashboards and Scorecards
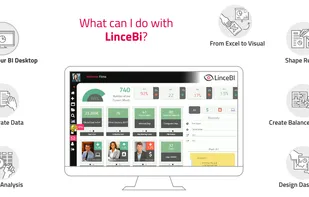
It´s fully customizable and you can include other BI tools in LinceBI BI Global Portal like PowerBI, Metabase...
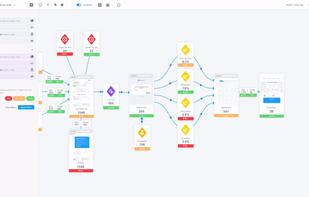
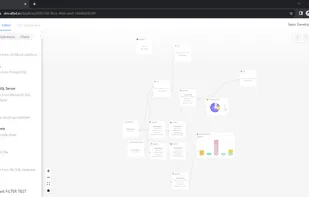
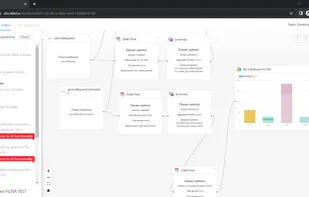
Visual whiteboarding and data analytics solution for planning, tracking, and optimizing marketing funnels, automating reports and centralizing performance measurement.
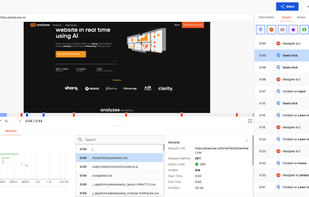
Analyzee is a free, unified SaaS for real-time analytics, customer engagements & session insights. Easily integrate with a single script, centralize data from multiple sources, and interact live with customers, all on a self-hosted, robust infrastructure.
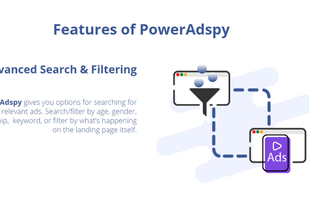
Access over 500,000 ad copies from more than 200,000 advertisers across 15+ countries, analyze ads from major platforms, bookmark favorites, and explore trends.
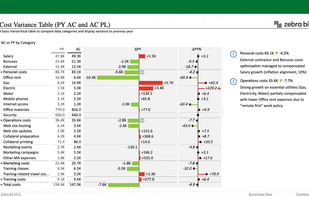
Advanced reporting toolkit for Power BI, Excel, and PowerPoint offering best-practice dashboards, powerful visualizations, quick setup, and actionable insights.
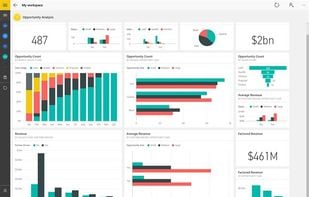
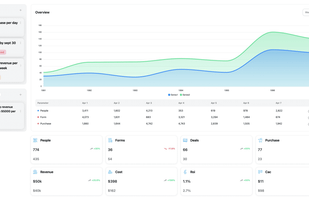
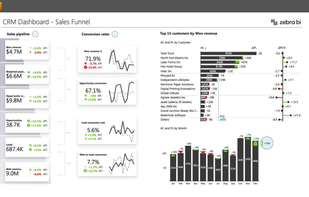
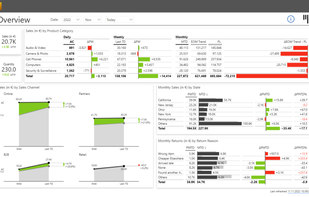
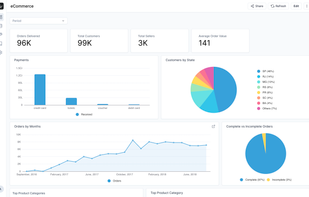
Create insightful reports & dashboards, Visually analyze your business information.
Easily create insightful reports & dashboards using a drag and drop interface. No IT help required.
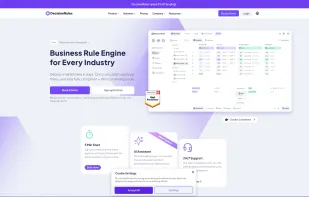
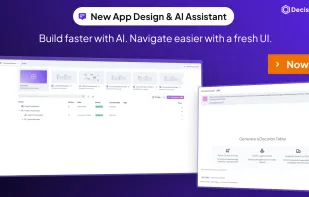
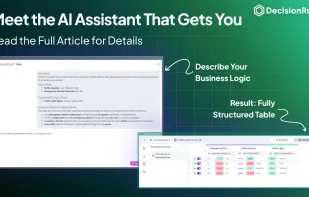
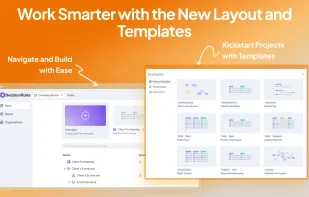
DecisionRules is designed to be your rules engine, making your day-to-day analyses and procedures easier, running your business more efficiently and smoothly. DecicionRules allows you to know what customers are eligible for certain products.
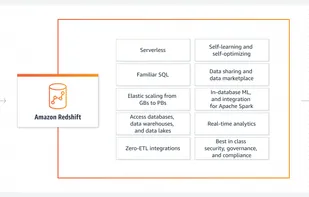
Amazon Redshift uses SQL to analyze structured and semi-structured data across data warehouses, operational databases, and data lakes, using AWS-designed hardware and machine learning to deliver the best price performance at any scale.
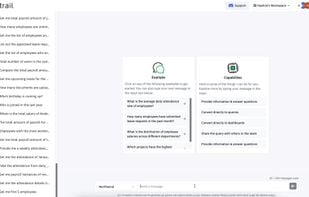
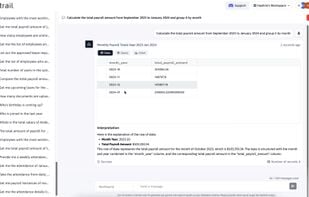
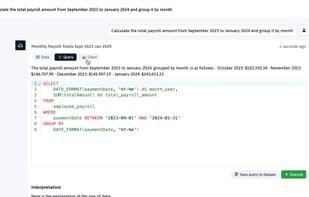
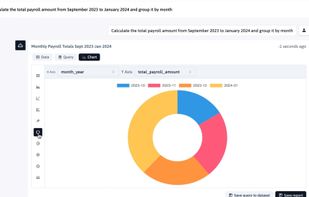
Flowtrail AI a Conversational AI analyst who will generate reports for you through a conversation with your data. Easily create insightful reports and dashboards from multiple databases, without the need for SQL expertise.
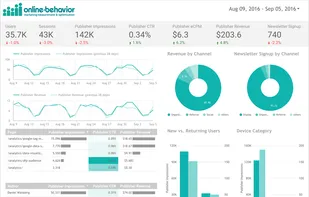
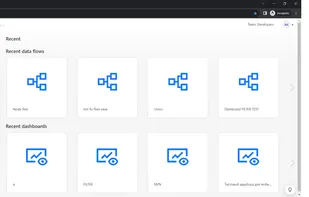
Data visualization and business intelligence (BI) platform for aggregating, sharing, collaborating, and pulling insights from raw databases, as well as built-in connections to Google products.
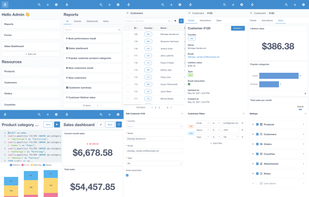
Stop developing your admin panel and focus on growing the actual product. The fastest and easiest way to bootstrap internal tools for your business. An open-source, no-code admin panel to manage your data, perform custom actions, build reports and dashboards.
Frappe Insights is an open-source data visualisation and analytics tool that helps you to analyse and optimise your business. It has been designed for a predictable and great user experience. It is built on top of Frappe Framework and is available for free.