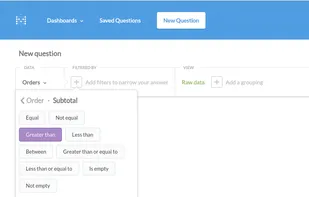
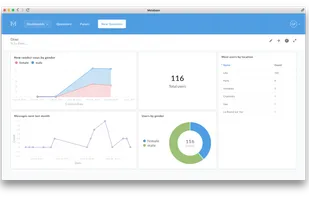
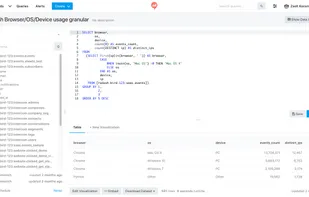
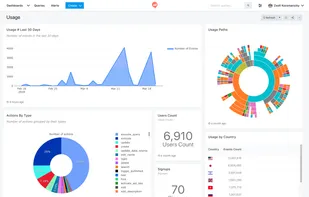
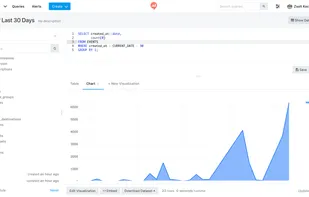
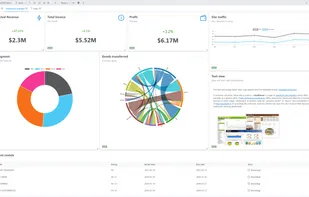
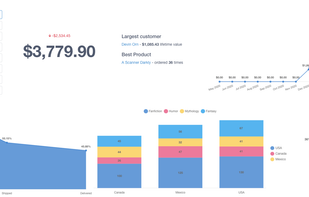
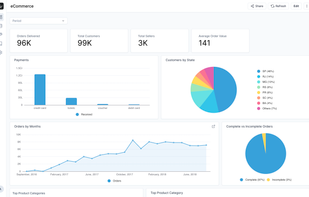
Metabase is a simple and powerful analytics tool which lets anyone learn and make decisions from their company’s data. No technical knowledge required! We hope you love it.
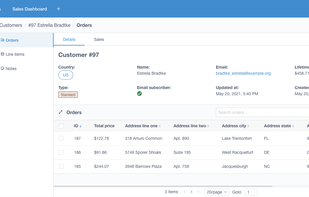
Stop developing your admin panel and focus on growing the actual product. The fastest and easiest way to bootstrap internal tools for your business. An open-source, no-code admin panel to manage your data, perform custom actions, build reports and dashboards.
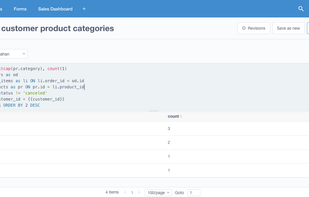
Frappe Insights is an open-source data visualisation and analytics tool that helps you to analyse and optimise your business. It has been designed for a predictable and great user experience. It is built on top of Frappe Framework and is available for free.
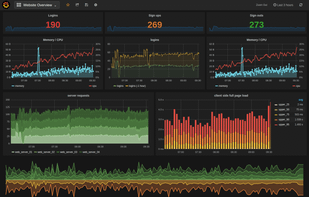
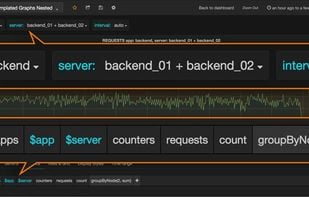
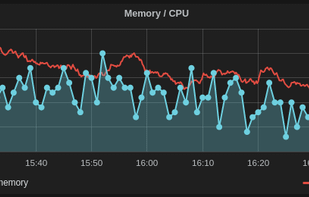
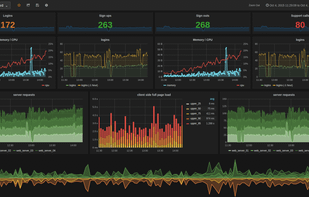
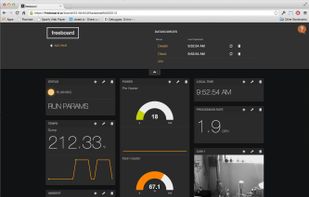
A damn sexy, open source real-time dashboard builder for IOT and other web mashups. A free open source alternative to Geckoboard. Includes a powerful plugin architecture to create any amount of customization.
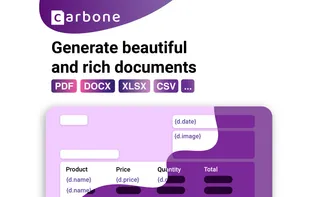
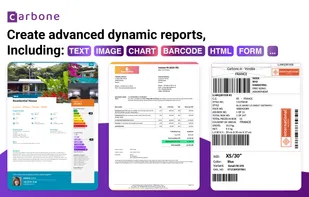
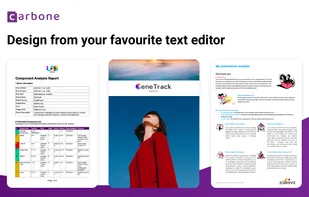
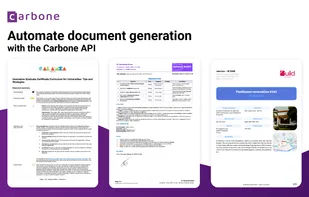
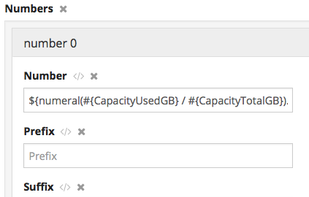
Automate the generation of documents from a universal templating engine. Create templates with your favourite text editor, and add dynamic content with Carbone tags (text, colours, images, graphs). Anybody can design beautiful documents.
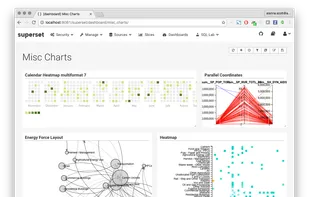
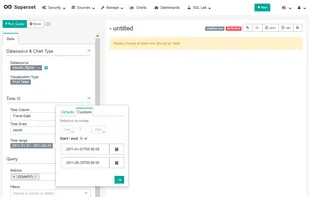
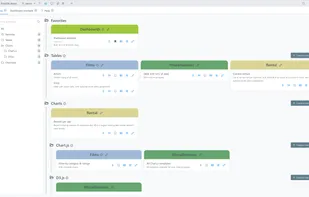
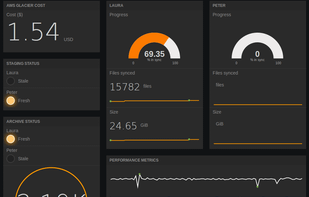
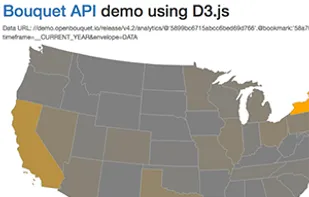
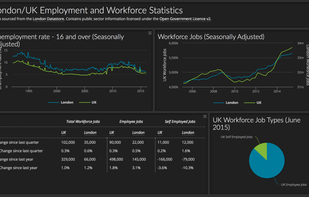
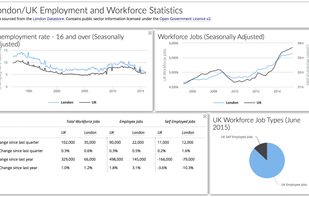
Browser-based platform for constructing dashboards using a declarative JSON approach with no programming needed, built-in editor, and direct hosting for non-programmers.
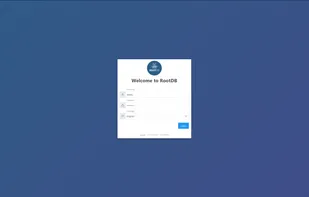
The FoundationDB Key-Value Store,
Rock solid. Versatile. Easy to operate.
The Key-Value Store is a database that combines scalability, fault-tolerance, and high performance with incredibly powerful multi-key ACID transactions.
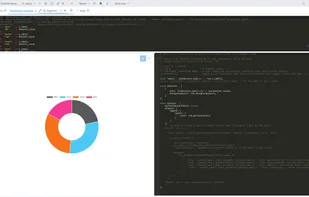
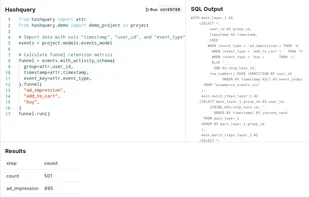
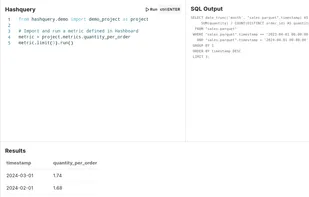
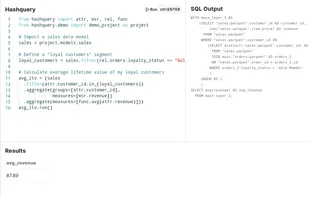
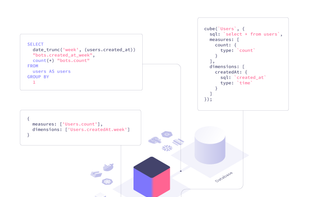
Cube.js is an analytics layer for modern applications. It supplies building blocks to add analytics features into any application you create. Cube.js is designed to work with large-scale data sets and implements various optimization techniques.
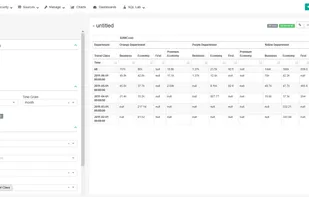
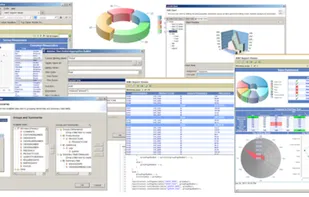
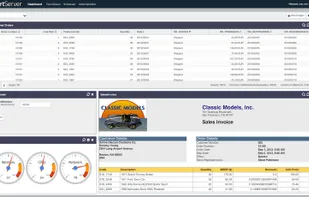
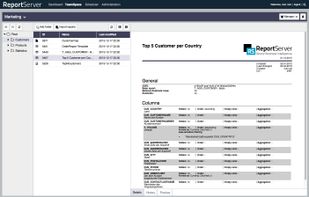
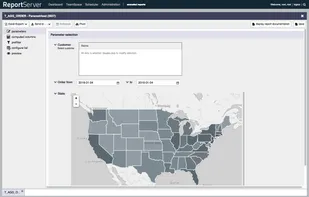
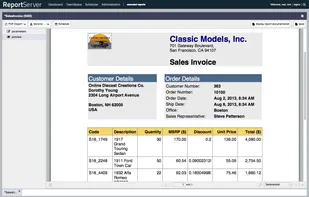
ReportServer is a web-based business intelligence platform that offers everything you need to evaluate your business. ReportServer comes with powerful ad-hoc analysis tools as well as with support for OLAP and pixel-perfect reporting.
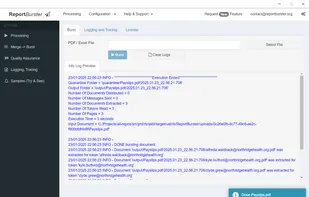
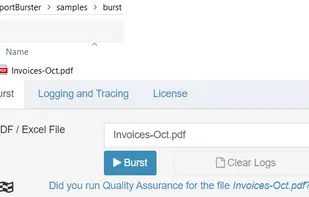
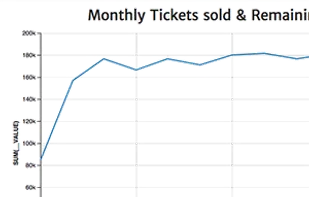
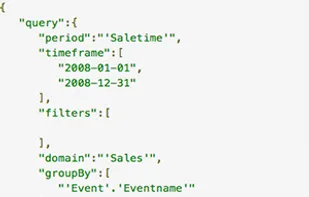
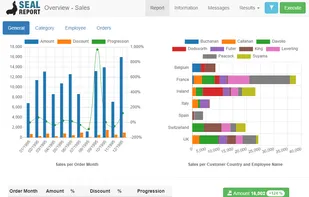
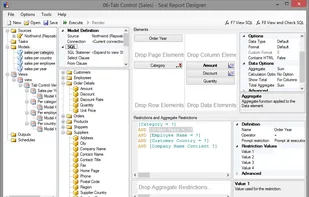
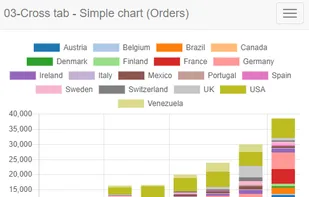
Seal Report offers a complete framework for producing daily reports from any database or any No SQL source.
The product focuses on easy installation and report design: Once setup, reports can be built and published in a minute.
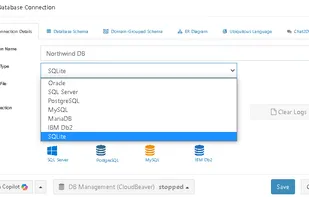
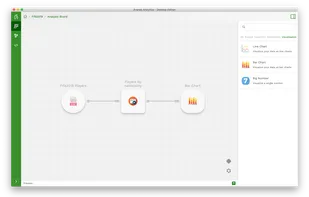
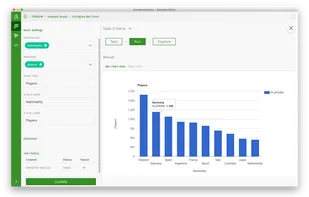
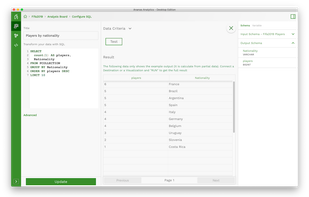
Ananas Analytics Desktop is a hackable data tool that helps your team combining non-technical and technical users to collaborate and build data analytics faster. Connect data from anywhere. Transform, analyze, and visualize to build analytics in minutes.
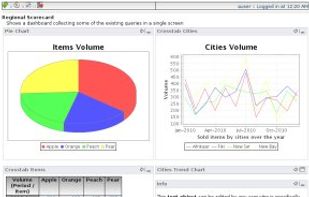
ART is a web based reporting solution. SQL queries can be published in a few minutes. It supports tabular, crosstab, charts, scheduling, email alerts, drill down, among other features. Results are exportable to spreadsheet/pdf.
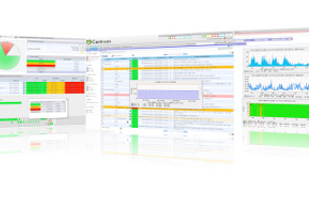
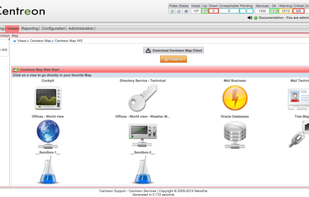
Features include: monitoring your servers, active elements and applications.
real-time operating and component management console.
maintenance and support for your whole platform by the solution publisher.
unlimited uses and extensions vi.
The easiest data analytics tool for end users. You can make impressive reports without a single line of code. Easy to use and easy to administrate. It have Open Source option or SaaS option.