Apps with 'Data visualization' feature Page 30 of 33

All apps in Apps with 'Data visualization' feature category. Use the filters below to narrow down your search. 
Copy a direct link to this comment to your clipboard
  1. Tracefour icon
     Like

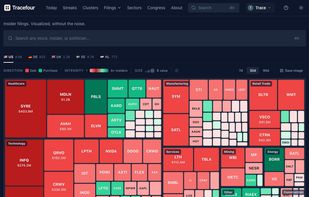
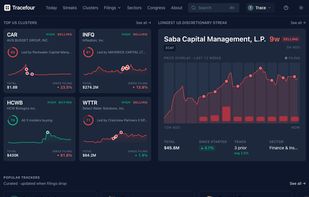
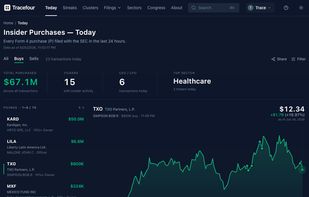
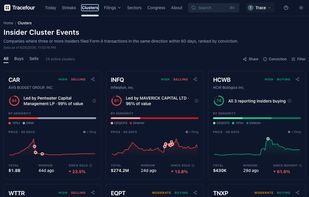
    Tracefour visualizes insider-trading filings from the US SEC (Form 4), the UK, Germany, Sweden and the Netherlands, plus US Congress (STOCK Act) disclosures as an interactive treemap heatmap, filings tables, and cluster/streak views. Sourced from public regulatory filings.

    Cost / License

    • Free
    • Proprietary

    Since

    • Since 2026

    Platforms

    • Online
    Tracefour screenshot 1
    Tracefour screenshot 1
    Tracefour screenshot 2
    +2
    Tracefour screenshot 3
    9 alternatives
  2. vMAP Portal is a web GIS which provides data visualization, analysis, route calculation, reporting with an easy-to-use interface, central rights & roles, and can be easily integrated with other tools like BI, CRM etc. without much coding and setups.

    Cost / License

    • Subscription
    • Proprietary

    Application type

    Since

    • Since 2019

    Platforms

    • Online
    • Self-Hosted
    • DE flagGermany
    • European Union flagEU
    Color filter feature
    Area dashboard feature
    Routing feature
    +3
    Object inspector feature
    11 alternatives
  3. Satoru icon
     Like

    Mood tracking, guided journaling, AI reflection, meditation, and breathing exercises with charts, health syncing, and encrypted data on iPhone and Android.

    Cost / License

    • Freemium (Subscription)
    • Proprietary

    Application type

    Since

    • New

    Platforms

    • Android
    • iPhone
    • iPad
    • Android Tablet
    • Apple Watch
    • US flagUnited States
    Satoru screenshot 1
    Satoru screenshot 2
    Satoru screenshot 3
    51 alternatives
  4. Palladium is a downloadable DNA encoded library software for data analysis, virtual screening, and resynthesis prioritisation. The industry standard for DEL hit-picking, Palladium is compatible with all DEL builds and manufacturers, is available on all major operating systems...

    Cost / License

    • Paid
    • Proprietary

    Since

    • Since 2026

    Platforms

    • Windows
    • Mac
    • Linux
    • GB flagUnited Kingdom
    Palladium DEL Follow-Up Suite screenshot 1
  5. Row Zero icon
     1 like

    Row Zero is the world's fastest spreadsheet. It is a last mile analytics tool that enables business teams to open 1 billion row data sets, connect data warehouses, and collaborate.

    Cost / License

    • Freemium (Subscription)
    • Proprietary

    Application type

    Since

    • Since 2024

    Platforms

    • Online
    • US flagUnited States
    Row Zero screenshot 1
    Row Zero screenshot 1
    Row Zero screenshot 2
    +1
    Row Zero screenshot 3
    8 alternatives
  6. ELKI icon
     1 like

    ELKI: "Environment for Developing KDD-Applications Supported by Index-Structures" is a development framework for data mining algorithms written in Java. It includes a large variety of popular data mining algorithms, distance functions and index structures.

    Cost / License

    Application type

    Since

    • Since 2017 (updated Aug 2026)

    GitHub

    • GitHub stars: 833

    Platforms

    • Windows
    • Mac
    • Linux
    ELKI screenshot 1
    ELKI screenshot 1
    ELKI screenshot 2
  7. Reef AI icon
     1 like

    A data storyteller and hack that helps you analyze trends, create visualizations and explain your findings through interactive audio conservations and texts.

    Cost / License

    • Freemium (Subscription)
    • Proprietary

    Since

    • Since 2025

    Platforms

    • Online
    Spreadsheet analysis
    Reef board
    Home
    Reconcile
  8. Nugit icon
     Like

    Nugit is driven by the desire to help people realise the possibilities of data, because decisions based on data, are simply better. We aim to get rid of complexity and make the data overload manageable for everyone.

    Cost / License

    • Paid
    • Proprietary

    Since

    • Since 2017

    Platforms

    • Windows
    • Mac
    • Linux
    • Chrome OS
    • Online
    • iPhone
    • iPad
    • Windows Mobile
    • SG flagSingapore
    Age-Gender Segmentation Analysis
    Performance by Device
    Top Performing Hours
    +1
    Lead Funnel
    1 alternative
  9. Instadeq icon
     Like

    The easiest way to explore and analyze your data and share findings to any device as always-up-to-date interactive visualizations, notebooks and dashboards.

    Cost / License

    • Subscription
    • Proprietary

    Since

    • Since 2022

    Platforms

    • Software as a Service (SaaS)
    • Self-Hosted
    • US flagUnited States
    Load data from Excel, Google Sheets, CSV or JSON Files via drag & drop or automate the updates using Webhooks
    A drag and drop environment with instant feedback that goes beyond basic data manipulation
    Responsive layouts for Phones, Tablets, Computers and TVs

Nothing to install, a modern web browser is all you need
    18 alternatives
  10. Tractorscope is the modern SQL editing and data visualization platform built by engineers and designers for developers. Embed analytics into your apps or websites with just a few lines of code, and save hundreds of hours of development time.

    Cost / License

    • Subscription
    • Proprietary

    Since

    • Since 2024

    Platforms

    • Online
    • Software as a Service (SaaS)
    Tractorscope screenshot 1
    1 alternative
  11. Juryn icon
     Like

    Free Chrome extension tracking ChatGPT, Gemini, Claude, and Grok usage with session trends, cost estimates, task categories, and local analysis.

    Cost / License

    • Free
    • Proprietary

    Since

    • New

    Platforms

    • Google Chrome
    • EE flagEstonia
    • European Union flagEU
    Dashboard view
    Juryn screenshot 1
    28 alternatives
  12. Datawatch icon
     Like

    Datawatch is the leading provider of visual data discovery solutions that allow organizations to optimize the use of any information whether it is structured, unstructured, or semi-structured data locked in content like static reports, PDF files, and EDI streams – in real-time...

    Cost / License

    • Paid
    • Proprietary

    Since

    • Since 2015

    Platforms

    • Online
    • Software as a Service (SaaS)
    30 alternatives
  13. Daymark icon
     Like

    Daymark is an AI-powered data discovery platform that brings all your business data into one unified workspace. It is built for marketing, sales, product, and founder teams who need fast, reliable answers from their data without writing SQL.

    Cost / License

    • Subscription
    • Proprietary

    Since

    • Since 2026

    Platforms

    • Online
    7 alternatives
  14. Unwrap icon
     Like

    Local-first data workspace for opening, understanding, and exploring unfamiliar data files and archives.

    Cost / License

    • Free
    • Proprietary

    Since

    • New

    Platforms

    • Online
    • DE flagGermany
    • European Union flagEU
    A workspace containing multiple datasets, documents, images, and detected connections from a real ChatGPT data export.
    Explore large datasets in a fast, structured table view with configurable columns.
    Browse records as readable cards, including nested values and structured fields.
    Inspect column types, null values, uniqueness, ranges, samples, and value distributions at a glance.
    4 alternatives
  15. Tracks sanctioned vessels on a live AIS map, comparing list identities with broadcasts and recording name, MMSI, flag, silence, and port-call changes.

    Cost / License

    • Freemium (Subscription)
    • Proprietary

    Since

    • New

    Platforms

    • Online
    • US flagUnited States
    Every ship on the sanctions lists on one live map. The bar on top counts how many are transmitting and how many have gone quiet.
    World replay: every listed ship at a chosen moment, with its recent track. Here, the Strait of Gibraltar, with one tanker's card open: its AIS name beside the names the UK, Australia, Canada and New Zealand list it under.
    A ship's card: the name it broadcasts beside the name each sanctions list gives it, with its IMO, MMSI, flag and last position.
    +3
    A listed tanker's track from Portugal through the Strait of Gibraltar. Amber stretches mark where she wasn't heard.
    5 alternatives
  16. Franz is a native macOS desktop client for Apache Kafka. It is not Open Source. I'm providing the source code here because I want users to be able to see the code they're running and even change and build it for themselves if they want to.

    Cost / License

    • Pay once
    • Proprietary

    Since

    • Since 2024

    Platforms

    • Mac
    Franz Client screenshot 1
    Franz Client screenshot 1
    Franz Client screenshot 2
    +3
    Franz Client screenshot 3
    5 alternatives
  17. Spoil your users with hyper-personalized customer-facing analytics and insights that adapt on demand and “Just-Works”.

    Cost / License

    • Subscription
    • Proprietary

    Since

    • Since 2025

    Platforms

    • Online
    • Software as a Service (SaaS)
  18. gogitype icon
     Like

    A beautiful, high-performance typing platform featuring deep analytics, anatomical finger heatmaps, and competitive multiplayer modes.

    Cost / License

    • Free
    • Proprietary

    Application type

    Since

    • Since 2026

    Platforms

    • Online
    • Software as a Service (SaaS)
    Test Pate
    Results Page
    Weak Keys Training (results page)
    +9
    Account Page (analytics)
    50 alternatives
  19. Institutional-grade quantitative analytics platform for market seasonality, day-of-week liquidity patterns, and black-swan crash analysis.

    Cost / License

    • Free
    • Proprietary

    Since

    • Since 2026

    Platforms

    • Online
    • ES flagSpain
    • European Union flagEU
    QuantEdge Analytics Seasonality Matrix Dashboard showing multi-asset historical performance, day-of-week win rates, and monthly return distributions in dark mode UI.
    QuantEdge Analytics Seasonality Matrix Dashboard showing multi-asset historical performance, day-of-week win rates, and monthly return distributions in dark mode UI.
    3 alternatives
  20. Yanzu Data is a cloud-based data analytics and visualization application. Yanzu Data lets you quickly build robust dashboards and visualizations, or just explore your data using SQL. Setup is easy: just connect to your database and you're running.

    Cost / License

    • Subscription
    • Proprietary

    Since

    • Since 2023

    Platforms

    • Online
    Yanzu Data screenshot 1
    5 alternatives
  21. Kepler.gl icon
     Like

    Kepler.gl is a powerful open source geospatial analysis tool for large-scale data sets.

    Cost / License

    • Free
    • Open Source (MIT)

    Since

    • Since 2023 (updated Sep 2026)

    GitHub

    • GitHub stars: 12k

    Platforms

    • Online
    • Self-Hosted
    • US flagUnited States
    Kepler.gl screenshot 1
    5 alternatives
  22. SQLwallet icon
     1 like

    SQLwallet's mission is to streamline day-to-day ad-hoc report creating and close the gap between developers and business to get away of data being sent in attached spreadsheets. SQLwallet server allows to create table reports from SQL queries, with advanced permissions...

    Cost / License

    • Subscription
    • Proprietary

    Since

    • Since 2017

    Platforms

    • Windows
    • Online
    • Self-Hosted
    • GB flagUnited Kingdom
    Chart report view
    Table report view
    Permissions view
    +1
    Design view
    33 alternatives