Cost / License
- Free
- Open Source
Application type
Since
- Since 2012
Alerts
- Discontinued


CODESYS is the leading manufacturer-independent IEC 61131-3 automation software for engineering control systems. It is used to program many hundreds of different controllers, PLCs, PACs and other automation system, even via an Industry 4.0 interface.
 Germany
 EU


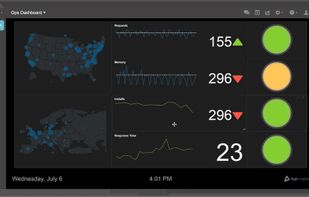
Gain insights and make informed decisions by letting you consolidate, visualize, and share your business's key metrics.
 United States


Designed by architects for architects, veteran visualization studio KA-RA has announced the release of Twinmotion®2, an award winning real-time studio that lets architects and designers create, edit and share interactive 3D models.
United States


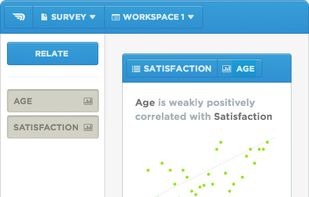
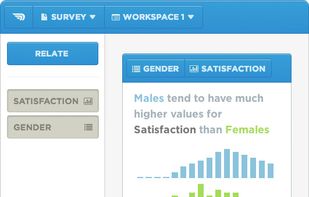
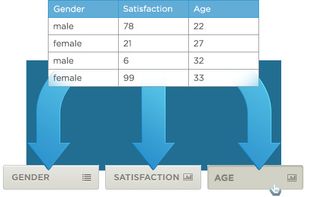
Statwing was built by and for analysts, so you can clean data, explore relationships, and create charts in minutes instead of hours. Simply upload your spreadsheet or dataset, then select the relationships you want to explore.
United States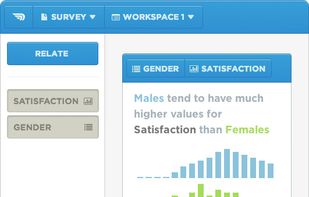
 R (programming language)

Software Box Shot Maker is able to create realistic images of 3D software boxes from your existing logos and promotional materials. You simply provide two to three images, adjust the box orientation and save the result as an image file.


Bringing together essential sales and marketing tools for growth-focused businesses. Visual CRM, Social and Marketing Automation Combined. Simply the parts of CRM and Marketing software you actually use, without the costs and integration hassles.
 United Kingdom


Experience your music collection as never before with this intense music driven arcade shooter. Each of your songs will have its own unique ebb and flow based on the music.


Jmol is a free, open source molecule viewer for students, educators, and researchers in chemistry and biochemistry. It is cross-platform, running on Windows, Mac OS X, and Linux/Unix systems.


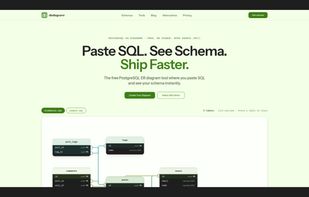
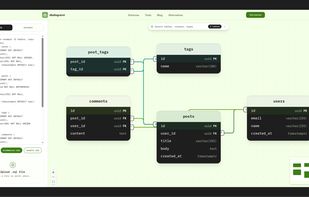
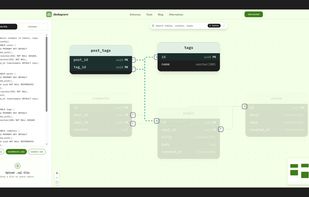
Free, open-source web tool that generates interactive ER diagrams from any PostgreSQL connection string. No signup required paste your connection string and visualize your schema in seconds.
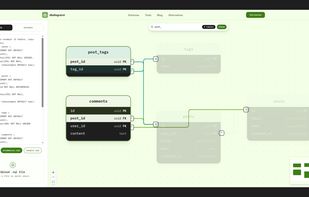

 DrawSQL

The WebGL Globe is an open platform for geographic data visualization. We encourage you to copy the code, add your own data, and create your own.
United States


RasMol is a computer program written for molecular graphics visualization intended and used primarily for the depiction and exploration of biological macromolecule structures, such as those found in the Protein Data Bank.


JavaScript InfoVis Toolkit is a JavaScript library for visualizations and diagrams. The JavaScript InfoVis Toolkit provides tools for creating Interactive Data Visualizations for the Web.


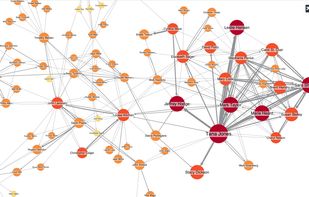
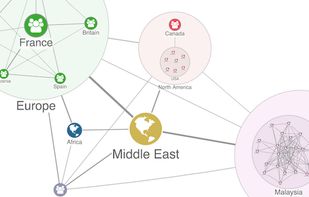
KeyLines is a JavaScript toolkit used by developers to build powerful network visualization applications, quickly.
United Kingdom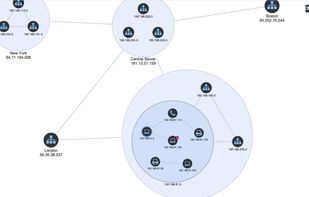


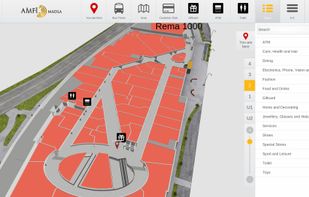
3D Architectural Visualization and Property Management Software Platform for 3D floor plans and building maps. Visualize, edit, embed your 3D floor plan and...


DADIM (do.adive.in) is an online music player with a sophisticated and highly configurable WebGL-based audio visualizer. Assemble playlists from SoundCloud links or local music files and enjoy audio-reactive visualizers spanning hundreds of presets.


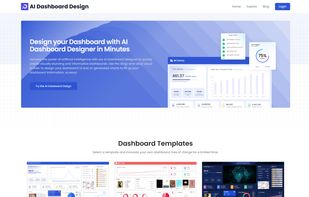
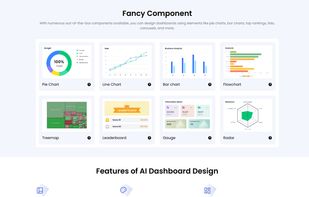
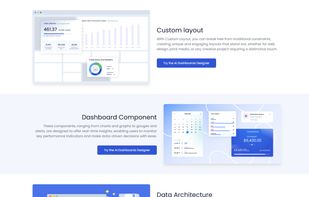
Dashboard Design is a powerful platform that allows you to easily build custom dashboards or databoards using AI-driven tools and a robust graph maker. Whether you need to design pie charts, bar graphs, flowcharts, or complex data visualizations, this tool simplifies the process.


Kineviz GraphXR is a browser-based visualization platform for interactive analysis of big, high dimensional, and or connected data.
United States


 Tweetalyzer 2and


 WinDirStatandduf

Reggy is a small OS X cocoa/objective-c application to very quickly visualize what a given regular expression will match given a test string. It will also tell you if you have errors in your regular expression.


Cinderella is the interactive geometry software and a universal tool for visualization and simulation of data and algorithms written in Java programming language. Cinderella is Math in motion.
GermanyEU