Self-hosted Windows Server software that monitors networks, servers, apps, cloud services and traffic, applying policy-based alerts and automation.
 Poland
 EU


+10


Best alternatives are 
 Uptime Kuma
137 alternatives Uptime Kuma


Self-hosted Windows Server software that monitors networks, servers, apps, cloud services and traffic, applying policy-based alerts and automation.
PolandEUUptime Kuma
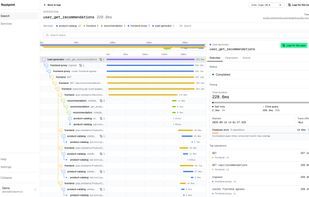
Grafana Tempo is an open-source, easy-to-use, and high-scale distributed tracing backend. Tempo lets you search for traces, generate metrics from spans, and link your tracing data with logs and metrics.
 SwedenEU



Grafana Alloy is Grafana Labs’ distribution of the OpenTelemetry Collector. It is an OTLP-compatible collector with built-in Prometheus optimizations that also supports signals across metrics, logs, traces, and profiles.
SwedenEU

A cloud-native observability platform built specifically for logs, metrics, traces, analytics, RUM (real user monitoring — performance, errors, session replay) designed to work at petabyte scale.
 United States
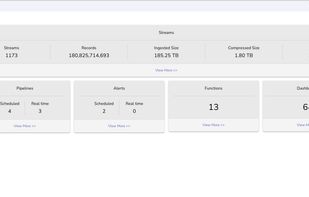

SigLens is a cutting-edge, purpose-built solution designed to efficiently manage massive volumes of data ranging from terabytes to petabytes, all while optimizing resource utilization. Functioning as a column-oriented database, SigLens incorporates dynamic columnar compressions...



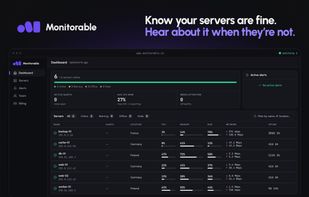
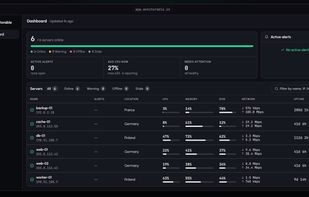
Hosted Linux monitoring installed with one command, using an open-source OTLP agent for host, Docker, systemd and disk health alerts.
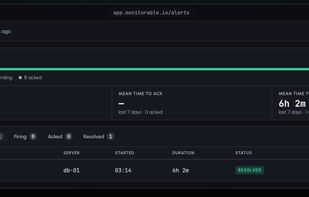 Uptime Kumaand


Open-source, self-hosted platform for logs and OpenTelemetry traces, with full-text search running on S3-compatible object storage.
PolandEU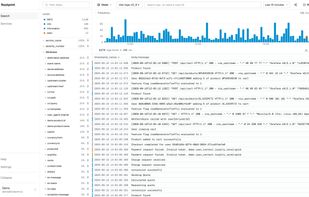
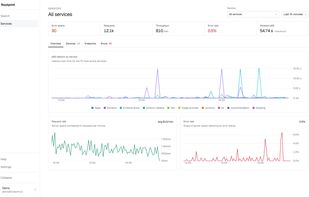

Ultralight open source server monitoring agent, written in Rust. Ships CPU, RAM, disk and network metrics over OTLP to any compatible backend.
Uptime Kumaand

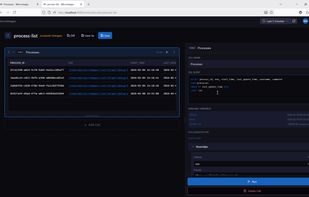
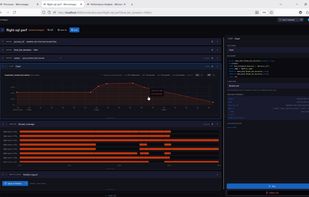
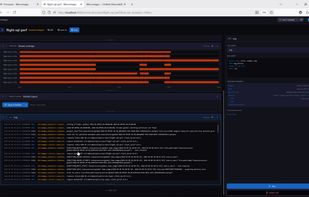
Micromegas is an open-source (Apache-2.0) observability stack that covers the whole path from instrumentation to dashboards.
 Canada

Error monitoring platform automates AI-generated fix proposals, integrates with Sentry SDK, supports multiple languages, is self-hosted, and drafts pull requests for review.
SwedenEU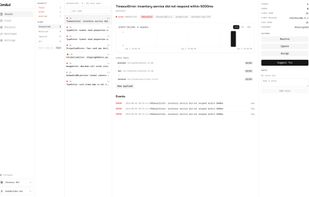


Grafana Mimir is an open source software project that provides a scalable long-term storage for Prometheus. Some of the core strengths of Grafana Mimir include:



MCPcat is an analytics platform for MCP server owners 🐱. It captures user intentions and behavior patterns to help you understand what AI users actually need from your tools — eliminating guesswork and accelerating product development all with one-line of code.
United States


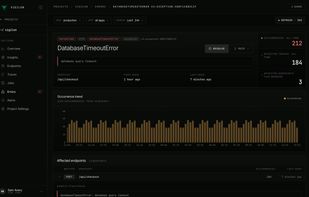
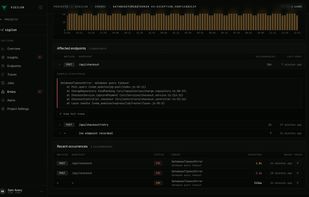
Vigilon watches your apps, endpoints and background jobs, and emails you when something breaks, slows down or stops running. It groups exceptions into error groups, keeps a trace for every error and slow request, and lets a coding agent read all of it through a hosted MCP server.
Canada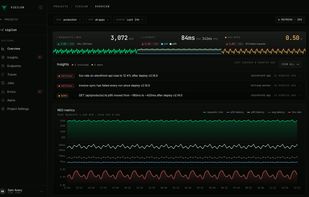


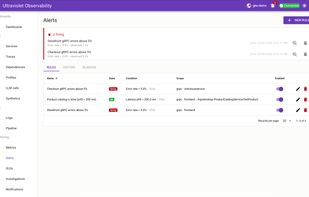
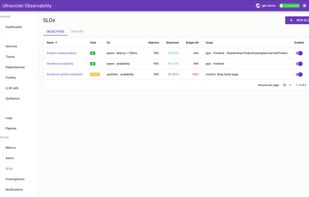
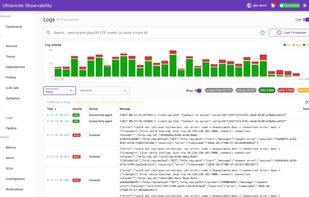
Self-hosted Kubernetes observability with eBPF tracing, metrics, logs, service maps, alerts and SLOs, running in your own or air-gapped environment.
United States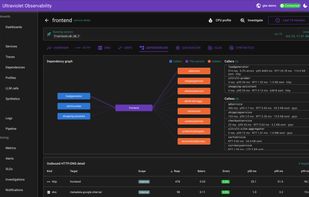
 United States












 Spain




 United Kingdom