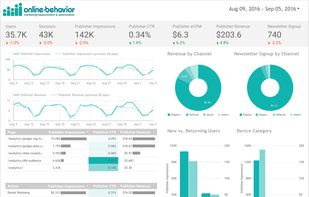
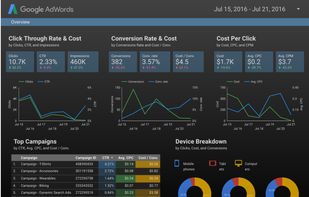
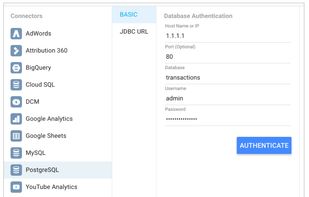
Data visualization and business intelligence (BI) platform for aggregating, sharing, collaborating, and pulling insights from raw databases, as well as built-in connections to Google products.
 United States



+1
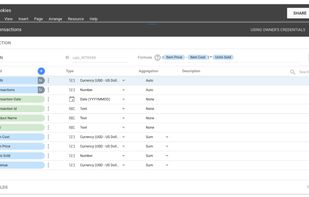


Data visualization and business intelligence (BI) platform for aggregating, sharing, collaborating, and pulling insights from raw databases, as well as built-in connections to Google products.
United States
Native scientific workspace for macOS enables exploratory data analysis, importing tabular datasets, creating X&Y, 3D plots, histograms, heat maps, and composing figures with vector export.


 R (programming language)

ParaView is an open-source, multi-platform application designed to visualize data sets of size varying from small to very large.

Siren is an all-in-one investigation platform that safeguards people, assets, and networks by integrating data from open sources, vendors, and classified channels.
United States


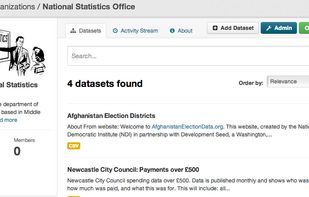
A complete out-of-the-box software solution that makes data accessible – by providing tools to streamline publishing, sharing, finding and using data.
 United Kingdom
 tap into data

New spreadsheet technology used to handle multi-dimensional data. Morphit is designed specifically to deal with complex high dimensional problems. It provides the flexibility to deal with the changing nature of biological studies and simplifies the process of capturing and...


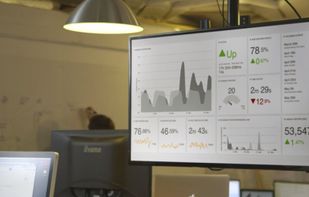
Geckoboard is a TV KPI dashboard that helps you and your team stay focused on the KPI that matter and monitor important business metrics.
United Kingdom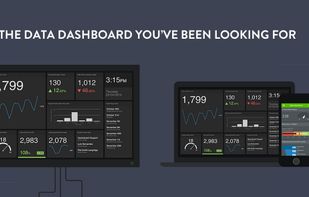




The mobile way to collect data on field. Convert all of your paper forms and processes into DataScope Platform to revolutionize the way you work.
 Italy
 EU



 Google Formsand


BlueSky Statistics is a fully featured statistics application and development framework built on the open source R project.
United States

Data Engineering is needlessly complex today. What if we can abstract away a lot of the tedious parts of this and let companies focus on just the data they want to store, and the questions they have on their data?
United States


 ONLYOFFICE

EnCase contains tools for several areas of the digital forensic process; acquisition, analysis and reporting. The software also includes a scripting facility called EnScript with various API's for interacting with evidence.
United States


StatsUp combines privacy-focused web analytics and uptime monitoring in one tool. Track pageviews, referrers, clicks, and site performance without cookies or invasive tracking. Manage multiple sites from a single dashboard. No bloat, just actionable insights.


Frappe Insights is an open-source data visualisation and analytics tool that helps you to analyse and optimise your business. It has been designed for a predictable and great user experience. It is built on top of Frappe Framework and is available for free.


It is a a learning platform to transform tech-education and talent and job search in the Artificial Intelligence industry. It provides onlinebootcamps to build and accelerate careers in the technology industry.


Users describe a problem, declare the range, and then Google Sheets Formula Generator provides a formula solution. Google Sheets Formula Generator can handle a range of user needs, and formula needs. Can solve simple calculations or figure out complex data manipulation.
United States


Lampyre - an efficient data analysis and OSINT multi-tool for everyone. Obtain, visualize and analyze data in one place to see what others can't.
 FranceEU


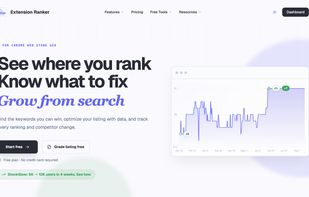
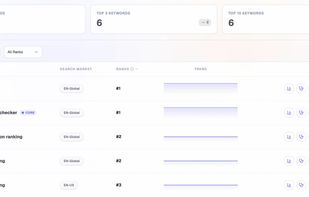
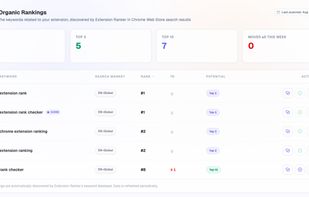
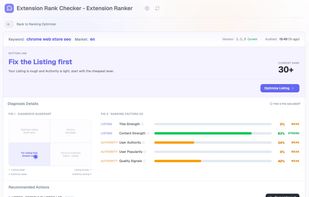
Track your Chrome extension's search ranking in the Chrome Web Store, find the keywords worth targeting, and see what to change in your listing to rank higher.





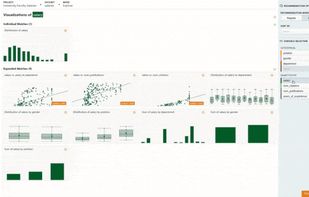
Lightweight data exploration tool combining semi-automated visualization and point-and-click statistical analysis into a unified workflow.
United States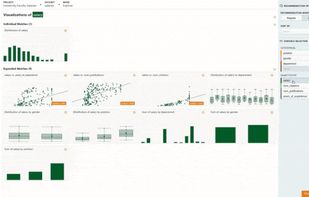


Data Elixir helps data scientists and engineers stay current with the latest news and technologies. We track down the best data-related news, resources, and inspirations from around the web each week and publish the collection as a free newsletter.


Vega-Lite provides a higher-level grammar for visual analysis, comparable to ggplot or Tableau, that generates complete Vega specifications. Vega-Lite specifications consist of simple mappings of variables in a data set to visual encoding channels such as x, y, color, and size.
United States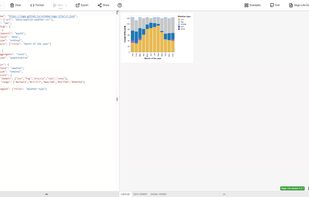

Snappy Mapper lets non-GIS users create geospatial vector data via a simple interface. Collect points and polygons, then export or access them via API — no GIS skills needed.
United Kingdom