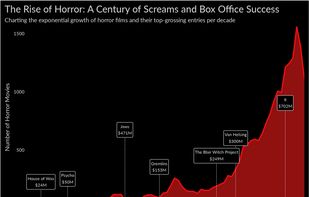
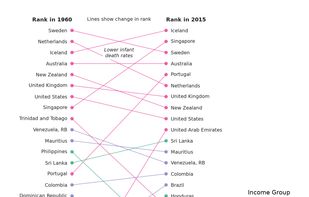
D3.js is a JavaScript library for manipulating documents based on data. D3 helps you bring data to life using HTML, SVG, and CSS.
 United States




+6


Apps similar to Vega-Lite include D3.js, which is free and open source. Other options are NVD3, Bokeh, C3.js and Vega Visualization Grammar. In total there are eight Charting Library Tools like Vega-Lite for the web, self-hosting, Mac, Windows and Linux.
D3.js is a JavaScript library for manipulating documents based on data. D3 helps you bring data to life using HTML, SVG, and CSS.
United States
This project is an attempt to build re-usable charts and chart components for d3.js without taking away the power that d3.js gives you. This is a very young collection of components, with the goal of keeping these components very customizeable, staying away from your standard...


Bokeh is a Python interactive visualization library that targets modern web browsers for presentation. Its goal is to provide elegant, concise construction of novel graphics in the style of D3.js, but also deliver this capability with high-performance interactivity over very...

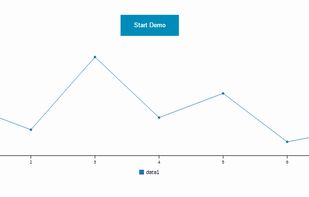
D3-based reusable chart library that enables deeper integration of charts into web applications
 Japan

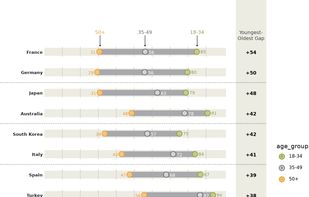
Vega is a visualization grammar, a declarative format for creating, saving, and sharing interactive visualization designs. With Vega, you can describe the visual appearance and interactive behavior of a visualization in a JSON format, and generate web-based views using Canvas or...
United States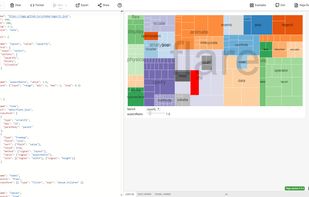


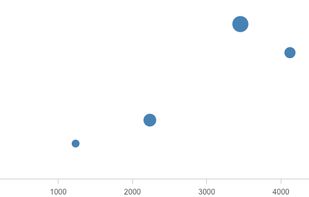
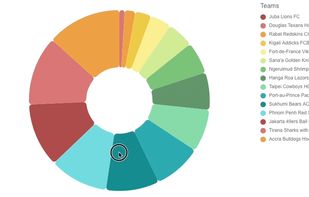
Turn boring data into a visual masterpiece using picasso.js, an open-source library from Qlik.
 Sweden
 EU


 FranceEU
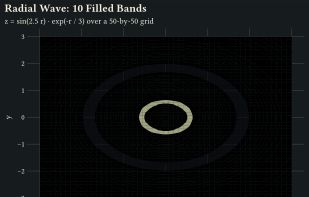
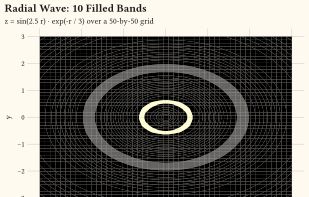
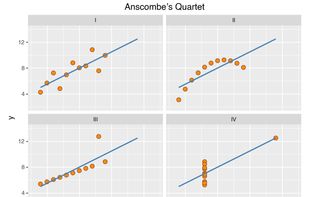
Plotnine is an implementation of a grammar of graphics in Python based on ggplot2. The grammar allows you to compose plots by explicitly mapping variables in a dataframe to the visual characteristics (position, color, size etc.) of objects that make up the plot.
 Uganda