Apps with 'Data visualization' feature Page 27 of 33

All apps in Apps with 'Data visualization' feature category. Use the filters below to narrow down your search. 
Copy a direct link to this comment to your clipboard
  1. Verfacto icon
     Like

    Verfacto is a machine-learning tool for e-commerce businesses that unifies customer data and turns it into marketing insights.

    Cost / License

    • Subscription
    • Proprietary

    Since

    • Since 2021

    Platforms

    • Software as a Service (SaaS)
    • LB flagLebanon
    Verfacto screenshot 1
    Verfacto screenshot 1
    Verfacto screenshot 2
    +1
    Verfacto screenshot 3
    35 alternatives
  2. A fully open-source agentic framework with visualization, hosting, and deployment developed by academic + professionals with good intent. No premium tiers or feature lock.

    Cost / License

    • Free
    • Open Source (MIT)

    Since

    • New

    GitHub

    • GitHub stars: 148

    Platforms

    • Windows
    • Mac
    • Linux
    • Self-Hosted
    • Python
    5 alternatives
  3. OxFrame icon
     Like

    Open-source Rust framework for code-driven motion graphics with async scenes, deterministic native rendering, timeline editing, and agent checks.

    Cost / License

    Application type

    Since

    • New

    GitHub

    • GitHub stars: 5

    Platforms

    • Windows
    • Mac
    • Linux
    • ES flagSpain
    • European Union flagEU
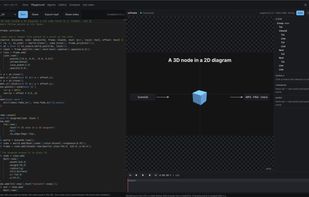
    A 3D node inside a 2D diagram: a lit cube turns in a View3d, and 2D labels follow points on its faces.
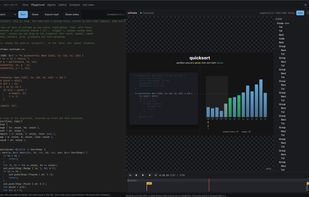
    Quicksort, step by step: the code with a moving focus, synced to bars that compare, swap and settle.
    9 alternatives
  4. RoboPeek icon
     Like

    Paste a Hugging Face link. RoboPeek works out the layout and opens the whole dataset: LeRobot v2 or v3, RLDS, MCAP, HDF5, Zarr, video folders, nested repos.

    Cost / License

    • Free
    • Open Source (MIT)

    Since

    • New

    GitHub

    • GitHub stars: 13

    Platforms

    • Online
    • US flagUnited States
    RoboPeek screenshot 1
    RoboPeek screenshot 1
    RoboPeek screenshot 2
    RoboPeek screenshot 3
    1 alternative
  5. Award-winning financial reporting and analytics app. Go from data to decisions in seconds. Used by over 50,000 accountants, bookkeepers and businesses.

    Cost / License

    • Freemium (Subscription)
    • Proprietary

    Since

    • Since 2020

    Platforms

    • Software as a Service (SaaS)
    • US flagUnited States
    Syft Analytics screenshot 1
    Syft Analytics screenshot 1
    Syft Analytics screenshot 2
    17 alternatives
  6. Widestage icon
     Like

    Light weight open source reports tool, that allows users to create their own HTML reports and dashboards just dragging and dropping elements, powered by a semantic layer.

    Cost / License

    • Free
    • Open Source

    Since

    • Since 2017

    Platforms

    • Windows
    • Mac
    • Linux
    • Self-Hosted
    Data explorer, allows you to drag and drop elements and create queries on the fly.
    Choose between grid, charts, gauges, etc... to visualise your data
    Mix up in a HTML page different reports and make them work together applying common filters
    16 alternatives
  7. Powerdrill AI is an AI SaaS service centered around personal and enterprise datasets—swift insights from your knowledge and data.

    Cost / License

    • Freemium (Subscription)
    • Proprietary

    Since

    • Since 2024

    Platforms

    • Online
    • GB flagUnited Kingdom
    Powerdrill AI:
Complete Your Data Job
10x Faster
    Ask Powerdrill AI for anything you want to know, or know from you data
    Experience data visualizations that make your data engaging and effortlessly digestible.
    19 alternatives
  8. KeepTool icon
     1 like

    A complete set of tools that contains everything you need for oracle application development and administration. Features SQL Editor, HTML Documentation Generator, Reverse DDL Engineer, DB compare, ER Diagrammer and PL/SQL Debugger.

    Cost / License

    • Paid
    • Proprietary

    Since

    • Since 2015

    Platforms

    • Windows
    KeepTool screenshot 1
    KeepTool Enterprise offers DBAs an organized view of all current sessions.
    See the differences between any two schemas in a database--or in different databases. Let DB Compare do the work.
    +5
    Understand the relationships in your database with KeepTools ER Diagrammer.
    6 alternatives
  9. Portfosis icon
     Like

    Analyse your investment portfolio with AI. Monte Carlo simulations, risk decomposition, stress tests, rebalancing advice, and macro insights - completely free.

    Cost / License

    • Free
    • Proprietary

    Since

    • Since 2026

    Platforms

    • Online
    • GB flagUnited Kingdom
    Overview page
    Portfosis AI
    Macroeconomic Insights
    Stock analyser
    26 alternatives
  10. Visualr icon
     Like

    The company delves into the product sector with Visualr— a data visualization tool with simple drag and drop functionality, coupled with enhanced custom features. The product helps in exploring business insights by converting data into Information.
    Cost / License

    • Paid
    • Proprietary

    Since

    • Since 2017

    Platforms

    • Windows
    • Mac
    • Online
    5 alternatives
  11. Naxely icon
     Like

    Turn CSV files and Google Sheets into branded, client-ready PDF reports with AI insights, charts, and anomaly detection in under 30 seconds.

    Cost / License

    • Freemium (Subscription)
    • Proprietary

    Since

    • Since 2026

    Platforms

    • Online
    • Software as a Service (SaaS)
    • IN flagIndia
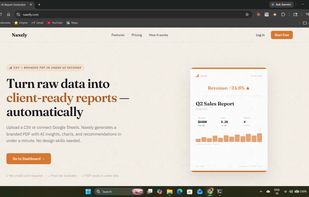
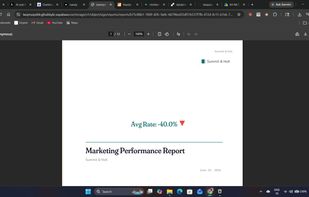
    Naxely homepage — upload CSV or Google Sheets and get a branded PDF report automatically
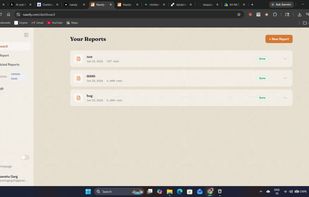
    Report management dashboard — view, download, and manage all generated reports
    Sample branded PDF output with charts and executive summary
    +1
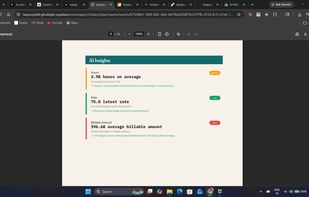
    AI-detected anomalies and data insights with severity indicators
    12 alternatives
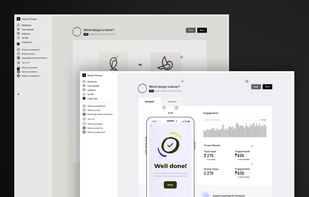
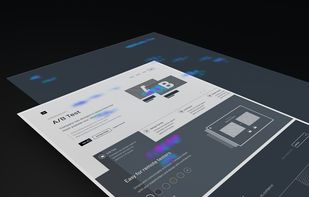
  12. Design VS Design enables designers to easily compare and evaluate visual ideas with their audiences without lengthy user testing sessions.

    Cost / License

    • Freemium (Subscription)
    • Proprietary

    Since

    • Since 2022

    Platforms

    • Online
    • Figma
    Design VS Design screenshot 1
    Design VS Design screenshot 1
    Design VS Design screenshot 2
    4 alternatives
  13. Gadfly icon
     Like

    Gadfly is a system for plotting and visualization written in Julia. It is based largely on Hadley Wickhams's ggplot2 for R and Leland Wilkinson's book The Grammar of Graphics. It was Daniel C. Jones' brainchild and is now maintained by the community.

    Cost / License

    • Free
    • Open Source

    Since

    • Since 2016 (updated Oct 2025)

    GitHub

    • GitHub stars: 1.9k

    Platforms

    • Windows
    • Mac
    • Linux
    5 alternatives
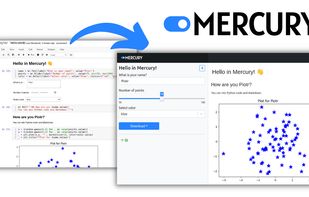
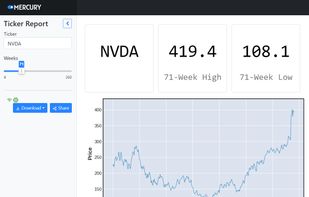
  14. Mercury allows you to add interactive widgets in Python notebooks, so you can share notebooks as web applications. Forget about rewriting notebooks to web frameworks just to share your results. Mercury offers a set of widgets with simple re-execution of cells.
    Cost / License

    Since

    • Since 2023 (updated Apr 2026)

    GitHub

    • GitHub stars: 4.3k

    Platforms

    • Online
    • Self-Hosted
    Mercury framework screenshot 1
    Mercury framework screenshot 1
    Mercury framework screenshot 2
    5 alternatives
  15. EZlytix icon
     Like

    EZlytix is a cloud-based Analytics in a box product. Our solution is designed for Mid-Market Manufacturing, Distribution, Retail organizations and small-mid size law firms.

    Cost / License

    • Subscription
    • Proprietary

    Since

    • Since 2020

    Platforms

    • Windows
    • Mac
    • Online
    • Android
    • iPhone
    • Android Tablet
    • Windows Mobile
    • Blackberry
    20 alternatives
  16. Engage icon
     Like

    Engage is a PowerPoint add-in that lets people of any skill level create and automate visually impressive presentations with infographics, pictograms and data maps.

    Cost / License

    • Paid
    • Proprietary

    Since

    • Since 2017

    Platforms

    • Windows
    • Microsoft Office Powerpoint
    • US flagUnited States
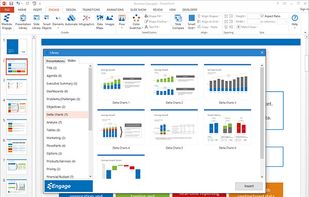
    Engage screenshot 1
    Engage screenshot 1
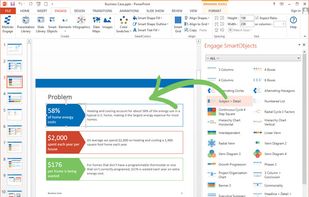
    Engage screenshot 2
    +7
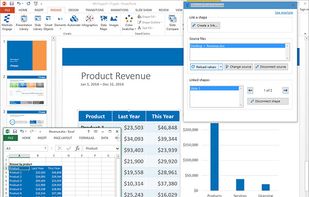
    Engage screenshot 3
  17. Cloud-Infra-Visualization is an open-source tool designed to programmatically create infrastructure designs, diagrams and technical overviews for Microsoft Azure.
    Cost / License

    Since

    • Since 2024 (updated Jan 2025)

    GitHub

    • GitHub stars: 32

    Platforms

    • Windows
    • Mac
    • Linux
    GUI
  18. Arcade Analytics is the easy-to-use graph visualization tool that lets you quickly transform your data into vibrant and engaging visual formats.

    Cost / License

    • Freemium (Pay once or Subscription)
    • Proprietary

    Since

    • Since 2018

    Platforms

    • Online
    • IT flagItaly
    • European Union flagEU
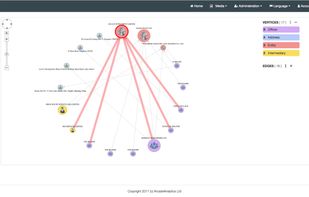
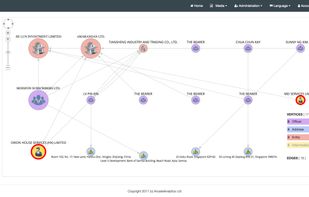
    Arcade Analytics screenshot 1
    Arcade Analytics screenshot 1
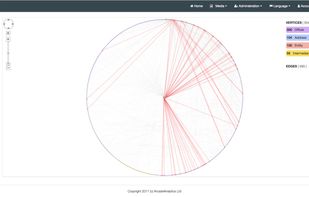
    Arcade Analytics screenshot 2
    5 alternatives
  19. Evernox icon
     Like

    Evernox is a browser-based tool for visually designing and managing relational databases with powerful features like real-time collaboration, AI-assisted SQL queries, and code generation in multiple languages and ORMs.

    Cost / License

    • Freemium (Subscription)
    • Proprietary

    Application type

    Since

    • Since 2025

    Platforms

    • Online
    • AT flagAustria
    • European Union flagEU
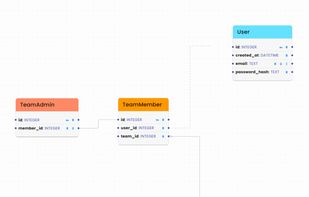
    Evernox Diagram
    18 alternatives
  20. SeeQL icon
     Like

    See your database in a new way. SeeQL is an easy-to-use desktop application that helps you visualize your database tables (including all foreign and primary key relationships), to quickly generate complex queries.

    Cost / License

    • Free
    • Open Source (MIT)

    Since

    • Since 2019 (updated Dec 2022)

    GitHub

    • GitHub stars: 341

    Platforms

    • Mac
    SeeQL screenshot 1
    SeeQL screenshot 1
    57 alternatives
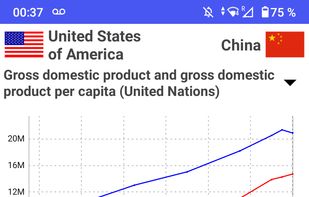
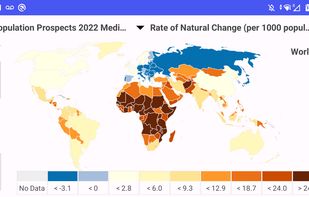
  21. Unlock a world of knowledge and exploration with "World Population Data," the Android application for visualizing country data from diverse datasets. Dive into a wealth of information, from population trends to energy consumption, agriculture to trade dynamics, and...

    Cost / License

    • Freemium (Pay once)
    • Proprietary

    Since

    • Since 2024

    Platforms

    • Android
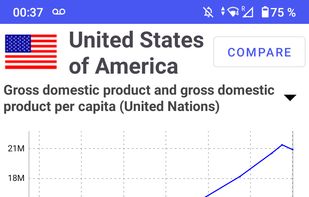
    World Population Data screenshot 1
    World Population Data screenshot 1
    World Population Data screenshot 2
    +4
    World Population Data screenshot 3