
Stratum Statistics icon

Stratum Statistics

Desktop app for Mac and Windows offering menu-driven statistics and data visualization with 30+ chart types, ANOVA, regression, PCA, ML, control charts, CSV/Excel import, 100+ formula functions, reporting, export options, offline use, and one-time purchase.
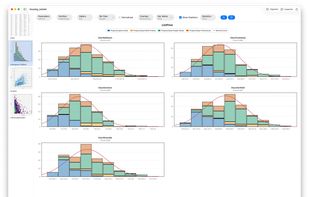
Stratum Statistics screenshot 1

Cost / License

  • Pay once
  • Proprietary

Application type

Platforms

  • Mac
  • Windows
0likes
0comments
0articles

Features

  1.  Works Offline
  2.  No Coding Required
  3.  Ad-free
  4.  Dark Mode
  5.  Data visualization
  6.  Statistical Testing
  7.  Charts
  8.  Data Mining
  9.  Data science

Stratum Statistics News & Activities

Highlights All activities

Recent activities

Stratum Statistics information

  • Licensing

    Proprietary and Commercial product.
  • Pricing

    One time purchase (perpetual license) ranging between $119 and $249.
  • Alternatives

    3 alternatives listed
  • Supported Languages

    • English
    • French
    • Spanish
    • German
    • Dutch
    • Chinese
    • Japanese
    • Korean
    • Portuguese
    • Italian
Stratum Statistics was added to AlternativeTo by stratumstats on and this page was last updated . Stratum Statistics is sometimes referred to as Stratum
No comments or reviews, maybe you want to be first?

What is Stratum Statistics?

Stratum is a native statistics and data-visualization application for macOS and Windows, built for analysts, researchers, and students who want serious statistical tools in a fast desktop app — without notebooks, scripting, or the cloud. Data stays local and offline.

It imports CSV and Excel files through a guided wizard, works comfortably with datasets of up to 5 million rows, and includes a formula engine with more than 100 functions plus filtering, sorting, and reshaping tools.

Charts — 30+ chart types: histograms, box and violin plots, scatter and bubble charts, bar and Pareto charts, pie, mosaic, heatmap, treemap, contour, trend, parallel-coordinate, slopegraph, dumbbell, dot, Q-Q, density, and ECDF — each with a full editor for titles, axes, colors, and annotations.

Statistics — descriptive statistics; correlation (Pearson, Spearman, Kendall); two-sample and paired comparisons; one-way and two-way ANOVA and MANOVA; contingency tables; and linear, multiple, and polynomial regression — with tests including Tukey, Welch, Wilcoxon, Kruskal-Wallis, Levene, and chi-square.

Machine learning — decision trees, random forests, boosted trees, clustering (k-means and hierarchical), and principal component analysis with scree plots and biplots.

Control charts — the full SPC family (I-MR, X¯-R, X¯-S, p, np, c, u) plus CUSUM and EWMA.

Reports and export — every analysis produces a formatted report and exports to PDF, image, Excel, or clipboard.

Stratum is available in 10 languages and is a one-time purchase with no subscription (Standard and Professional editions), with a free trial.

Stratum Statistics Videos