Apps with 'Data visualization' feature Page 14 of 33

All apps in Apps with 'Data visualization' feature category. Use the filters below to narrow down your search. 
Copy a direct link to this comment to your clipboard
  1. Veezoo icon
     8 likes

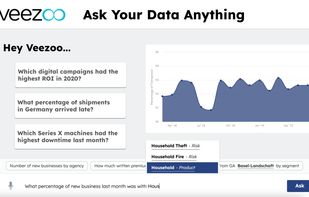
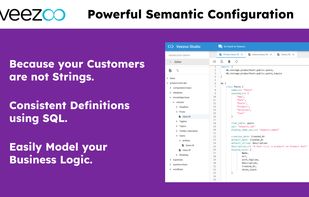
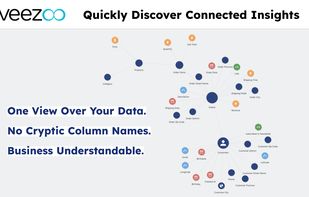
    Veezoo is a chat-based data analytics solution that empowers anyone to find actionable insights from data by literally just asking their questions in plain English!

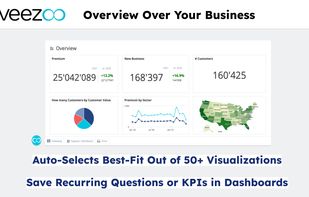
    Ask questions and get answers in seconds via meaningful data visualizations.

    Cost / License

    • Subscription
    • Proprietary

    Since

    • Since 2021

    Platforms

    • Online
    • Software as a Service (SaaS)
    • Self-Hosted
    • CH flagSwitzerland
    Veezoo screenshot 1
    Veezoo screenshot 1
    Veezoo screenshot 2
    +1
    Veezoo screenshot 3
    36 alternatives
  2. A complete cloud-first data platform that includes a multi-model transactional data management engine, an application development platform, and interoperability engine, and an open analytics platform.

    Cost / License

    • Subscription
    • Proprietary

    Application type

    Since

    • Since 2020

    Platforms

    • Windows
    • Mac
    • Linux
    • Software as a Service (SaaS)
    23 alternatives
  3. KiniMetrix icon
     3 likes

    Our approach blends proprietary metrics and frameworks, smart Business Intelligence software, insightful analytics, and creative problem-solving to help businesses achieve their bottom-line goals.

    Cost / License

    • Pay once
    • Proprietary

    Since

    • Since 2015

    Platforms

    • Online
    KiniMetrix screenshot 1
    KiniMetrix screenshot 1
    KiniMetrix screenshot 2
    +9
    KiniMetrix screenshot 3
    50 alternatives
  4. Flexmonster icon
     7 likes

    Flexmonster Pivot is a feature-rich JavaScript library for web reporting. The component connects to any data source and perfectly visualizes data from MongoDB, Elasticsearch, OLAP cubes, SQL, NoSQL databases, or JSON / CSV files up to 1GB.

    Cost / License

    • Pay once
    • Proprietary

    Since

    • Since 2009

    Platforms

    • Online
    • Software as a Service (SaaS)
    • BG flagBulgaria
    • European Union flagEU
    Pivot Table
    44 alternatives
  5. CleanMyData icon
     1 like

    CleanMyData fixes messy CSVs, encoding errors, and formatting issues instantly. Designed for e-commerce, data pros or anyone working with data who needs clean, ready-to-use files.

    Cost / License

    • Pay once
    • Proprietary

    Since

    • Since 2026

    Platforms

    • Online
    CleanMyData screenshot 1
    CleanMyData screenshot 1
    CleanMyData screenshot 2
    CleanMyData screenshot 3
    3 alternatives
  6. Demografy icon
     1 like

    Demografy uses AI to predict customer demographics from names with 100% coverage, accuracy preview before purchase and GDPR-compliance.

    Cost / License

    • Pay once or Subscription
    • Proprietary

    Since

    • Since 2020

    Platforms

    • Software as a Service (SaaS)
    • US flagUnited States
    Demografy screenshot 1
    Demografy screenshot 1
    Demografy screenshot 2
    +2
    Demografy screenshot 3
    1 alternative
  7. DataViz Kit icon
     1 like

    DataViz Kit provides a comprehensive suite of powerful, free, and easy-to-use tools that empower anyone—from students to professionals—to transform raw data into beautiful, insightful charts and graphs. No coding required, just clarity and impact.

    Cost / License

    • Free
    • Proprietary

    Since

    • Since 2025

    Platforms

    • Online
    DataViz Kit's Home Page
    DataViz Kit Logo
    5 alternatives
  8. Log Parser Lizard is a versatile GUI tool that provides query access (using SQL) to text-based data, such as log files, XML files, Event Logs, TSV/CSV text files, as well as databases like MS SQL Server, Google BigQuery, OLEDB (MySQL, Oracele, etc.).

    Cost / License

    • Freemium (Pay once)
    • Proprietary

    Application type

    Since

    • Since 2015

    Platforms

    • Windows
    • NL flagNetherlands
    • European Union flagEU
    Log Parser Lizard screenshot 1
    Log Parser Lizard screenshot 1
    Log Parser Lizard screenshot 2
    +3
    Log Parser Lizard screenshot 3
    77 alternatives
  9. Ubiq icon
     9 likes

    Ubiq is a web-based Reporting and Business Intelligence application. It enables users to easily explore, visualize and analyze data. Users can quickly create reports and dashboards using data visualizations without any programming and share them with others.

    Cost / License

    • Subscription
    • Proprietary

    Since

    • Since 2015

    Platforms

    • Windows
    • Mac
    • Linux
    • Online
    • Android
    • iPhone
    • iPad
    Ubiq screenshot 1
    Ubiq screenshot 1
    Ubiq screenshot 2
    Ubiq screenshot 3
    73 alternatives
  10. Card Ladder icon
     1 like

    Search for any sale of any trading card and find the most up to date values. We are the only price guide with every public sale in our database going back to 2000.

    Cost / License

    • Freemium (Subscription)
    • Proprietary

    Application type

    Since

    • Since 2024 (updated Feb 2026)

    Platforms

    • Online
    • Android
    • iPhone
    • iPad
    • US flagUnited States
    Card Ladder screenshot 1
    Card Ladder screenshot 2
    Card Ladder screenshot 3
    20 alternatives
  11. Slemma icon
     4 likes

    Slemma is a collaborative, data analytics platform designed for small to medium-sized businesses. The tool is accessible directly through the browser and doesn't need any hardware to run. This on-demand model, combined with its intuitive interface, makes it perfect for...

    Cost / License

    • Paid
    • Proprietary

    Since

    • Since 2015

    Platforms

    • Online
    Slemma screenshot 1
    Slemma screenshot 1
    Slemma screenshot 2
    26 alternatives
  12. Exmergo Viz icon
     1 like

    Exmergo Viz is the Dashboard AI Agent. It lets anyone build shareable, interactive, and reliable dashboards without the steep learning curve of traditional BI tools like Tableau and Power BI. Just talk to Viz in natural language, and it builds charts and dashboards for you in...

    Cost / License

    • Freemium (Subscription)
    • Proprietary

    Since

    • Since 2026

    Platforms

    • Online
    • Software as a Service (SaaS)
    • US flagUnited States
    Showcase Page
    Landing Page
    Agent Progress
    +2
    Share
    10 alternatives
  13. Lupus Labs icon
     1 like

    Lupus Labs is a modern alternative to think-cell for automated, data-driven presentations. It generates and updates PowerPoint slides from structured data and supports clear roadmaps and timelines—reducing manual effort and ensuring consistency across reports and project plans.

    Cost / License

    • Free
    • Proprietary

    Since

    • Since 2026

    Platforms

    • Online
    • Software as a Service (SaaS)
    • DE flagGermany
    • European Union flagEU
    Build compelling timelines that tell a story—from strategic vision to key milestones—fully customizable and visually engaging.
    Create complex program roadmaps in minutes—automatically structured, clearly visualized, and always presentation-ready.
    Turn project plans into clean, executive-ready Gantt charts with integrated milestones, timelines, and dependencies.
    11 alternatives
  14. Embedful icon
     1 like

    Embedful turns analytics into a feature your customers can see and interact with. Build charts, tables, counters, and dashboards in minutes using Google Analytics, Google Sheets, Excel, CSV files or APIs, and share them instantly.

    Cost / License

    • Freemium (Subscription)
    • Proprietary

    Since

    • Since 2026

    Platforms

    • Online
    • PH flagPhilippines
    Embedful screenshot 1
    4 alternatives
  15. A powerful online JSON formatter, editor and validator with multiple visualization modes including code, tree, table and graph views, making JSON debugging and manipulation effortless.

    Cost / License

    • Free
    • Proprietary

    Since

    • Since 2025

    Platforms

    • Online
    Powerful formatter that instantly transforms messy JSON into beautifully indented, readable code with real-time syntax highlighting. The formatter automatically detects errors and validates JSON structure as you type, ensuring your code is always valid
    Transform your JSON data into visual representations with four distinct viewing modes - Code, Tree, Table, and Graph views, making it easier to understand complex JSON structures
    Compare two JSON documents side by side with color-coded highlighting that instantly shows additions, modifications, and deletions. The diff tool offers customizable options like word wrap and syntax highlighting to make differences easily noticeable
    +1
    A full-featured code editor with advanced capabilities like syntax highlighting, auto-completion, and bracket matching for efficient JSON editing. The editor handles large JSON files smoothly while providing real-time validation feedback
    56 alternatives
  16. Similio icon
     4 likes

    Similio is a multilingual Austrian internet platform that combines geography, topics and points of interest. All information is presented in various granularities and visualized by means of maps.

    Cost / License

    • Free Personal
    • Proprietary

    Since

    • Since 2020

    Platforms

    • Online
    Similio screenshot 1
    Similio screenshot 1
    Similio screenshot 2
    +2
    Similio screenshot 3
    7 alternatives
  17. Free no-code editor for interactive maps and data visualizations: choropleth, points, cartograms, flow maps, with built-in Italian geo-joins, published as responsive embeds.

    Cost / License

    Application type

    Since

    • Since 2026 (updated Oct 2026)

    Platforms

    • Online
    • IT flagItaly
    • European Union flagEU
    zornade studio screenshot 1
    zornade studio screenshot 1
    zornade studio screenshot 2
    +1
    zornade studio screenshot 3
    9 alternatives
  18. HealthMap icon
     1 like

    HealthMap, a team of researchers, epidemiologists and software developers at Boston Children's Hospital founded in 2006, is an established global leader in utilizing online informal sources for disease outbreak monitoring and real-time surveillance of emerging public health...

    Cost / License

    • Free
    • Proprietary

    Since

    • Since 2014

    Platforms

    • Online
    HealthMap screenshot 1
    HealthMap screenshot 1
    HealthMap screenshot 2
    HealthMap screenshot 3
  19. From MIX Online comes Tweet Archivist, an online tool to archive, analyze, visualize, save and export tweets.

    Cost / License

    • Free
    • Proprietary

    Since

    • Since 2011

    Platforms

    • Online
    2 alternatives
  20. HooMap icon
     1 like

    HooMap is a browser-based tool designed to transform CSV and Excel coordinate data into interactive maps in seconds. Built for researchers, students, and data enthusiasts, it allows you to visualize spatial data directly in your workflow without the need for complex GIS software...

    Cost / License

    • Freemium (Subscription)
    • Proprietary

    Application type

    Since

    • Since 2026

    Platforms

    • Online
    • Software as a Service (SaaS)
    HooMap screenshot 1
    HooMap screenshot 1
    HooMap screenshot 2
    +2
    HooMap screenshot 3
    149 alternatives
  21. marimo icon
     2 likes

    A reactive notebook for Python — run reproducible experiments, execute as a script, deploy as an app, and version with git.

    Cost / License

    Since

    • Since 2024 (updated Nov 2026)

    GitHub

    • GitHub stars: 23.6k

    Platforms

    • Windows
    • Mac
    • Linux
    • BSD
    • Software as a Service (SaaS)
    • Visual Studio Code
    • US flagUnited States
    marimo screenshot 1
    marimo screenshot 1
    marimo screenshot 2
    +1
    marimo screenshot 3
    11 alternatives
  22. TalktoData is Your 24/7 AI Data Analyst. Unlock insights effortlessly with TalktoData. No coding, no hassle—just connect your spreadsheets or SQL databases and ask your data questions. Get real-time answers and visualizations, anytime you need them.

    Cost / License

    • Freemium (Subscription)
    • Proprietary

    Since

    • Since 2024

    Platforms

    • Online
    AI Assistant analysing the data and Generating Visualisations
    AI Assistant auto suggesting next logical questions for exploratory Data Analysis
    4 alternatives
  23. Beebotte icon
     4 likes

    Beebotte is a cloud platform providing key building blocks to accelerate the development of the Internet of Things and Real time connected applications. Beebotte supports REST, Websockets and MQTT to connect anything and everything in real time.

    Cost / License

    • Freemium
    • Proprietary

    Since

    • Since 2014

    Platforms

    • Windows
    • Linux
    • Online
    • Raspberry Pi
    • BeagleBoard
    • Cubieboard
    16 alternatives
  24. Reportz icon
     2 likes

    Automated, white-label KPI digital marketing reporting tool that allows you to track web metrics in real-time, import data from numerous integrated data sources, and create comprehensive, shareable reports. One live link per client. Access anytime.

    Cost / License

    • Subscription
    • Proprietary

    Since

    • Since 2017

    Platforms

    • Software as a Service (SaaS)
    • RS flagSerbia
    Reportz Website
    List of all Reportz Integrations
    Detailed Monthly E-Commerce report - super useful for website owners or marketers that want an all-in-one report for their PPC efforts and their e-commerce data. Includes KPIs from Google Analytics, WooCommerce, Facebook Ads & Google Ads.
    +2
    Basic SEO Report - mostly used by SEO professionals that want an all-around view of the performance of their website that includes all metrics shown on an Organic level and on All Traffic level. 
This template consists of KPIs from Google Analytics, Google Search Console, Google My Business, SERanking & RankRanger.
    1 alternative