


think-cell chart helps create bar charts, waterfall charts, Marimekko charts and Gantt charts, on Microsoft PowerPoint presentation slides from Microsoft Excel data sheets.
Cost / License
- Paid
- Proprietary
Since
- Since 2012
 Germany
 EU

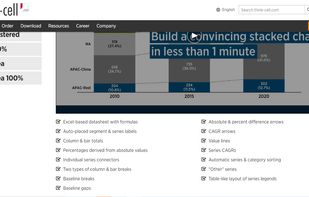


Apps similar to Lupus Labs include think-cell chart. It's paid, but Power Up Kit is free. Other options are Zebra BI, UpSlide, AnyChart and Vizzlo. You can choose from more than 10 Business Intelligence Tools like Lupus Labs for Windows, Mac, the web, Android and iPhone.
think-cell chart helps create bar charts, waterfall charts, Marimekko charts and Gantt charts, on Microsoft PowerPoint presentation slides from Microsoft Excel data sheets.
GermanyEU
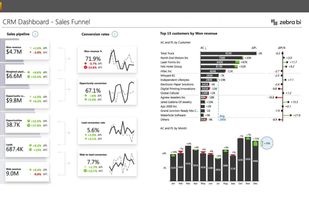
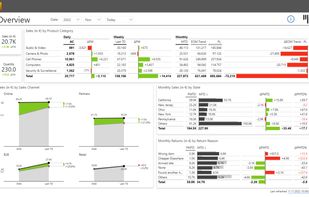
Advanced visualization toolkit for creating interactive dashboards, business reports, and presentations in Power BI, Excel, and PowerPoint. Features include dynamic comments, focus mode, drill-through, automated comparatives, and ready-made templates for fast setup.
 SloveniaEU
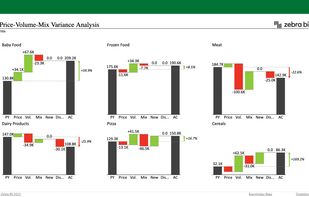
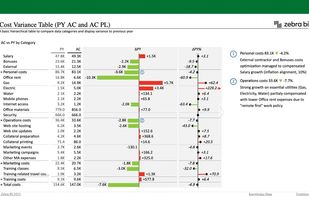


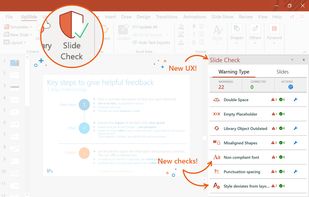
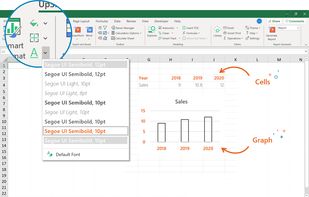
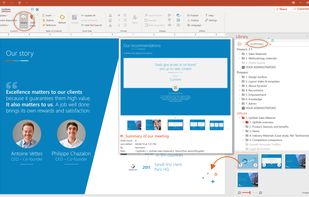
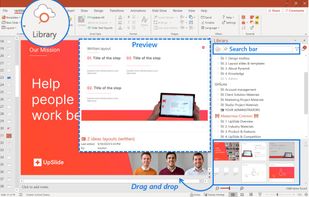
UpSlide plug-in allows you to perform routine Microsoft Excel, Word and PowerPoint tasks 5x faster making productivity gains of 12 hours per month. For example: link Excel to PowerPoint easily, access your up-to-date documents directly from Office...
 FranceEU


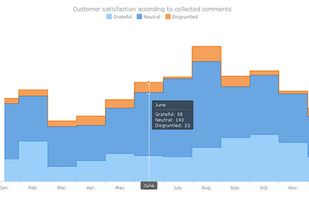
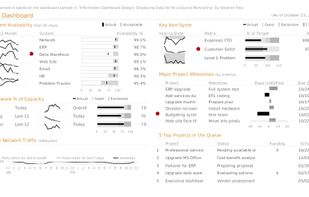
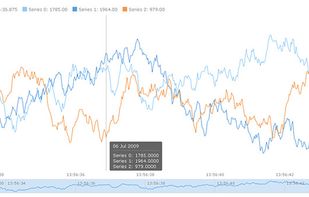
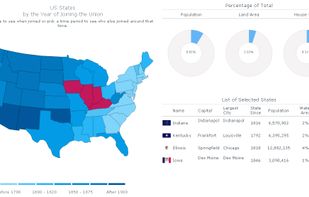
Flexible, cross-platform and cross-browser JavaScript (HTML5) charting library that allows you to create interactive bar, pie, line, spline, area, Gantt, stock and other charts, maps and dashboards, with real-time updates and multi-level drill-downs.
 United States


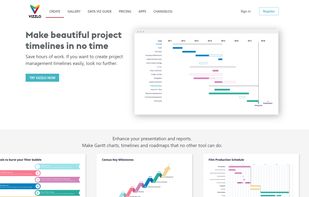
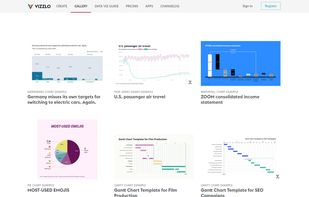
Vizzlo is a browser-based tool to create professionally designed charts, graphics, and business visualizations in just a few seconds. Preparing high-quality visual aids for presentations can be time intensive, and results are usually not satisfactory.
GermanyEU



Aploris offers a chart editor for PowerPoint for easy design of business graphs with advanced features. All typical chart types are supported as well as advanced type like Marimekko, waterfall and Gantt chart.


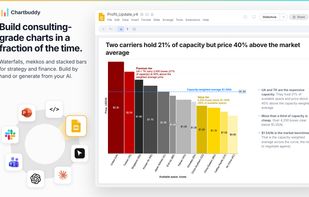
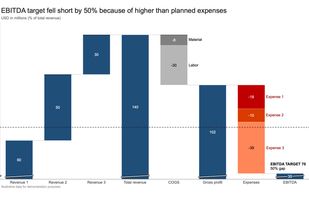
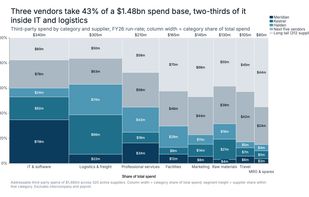
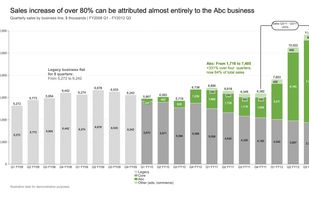
Build waterfalls, mekkos and stacked bars natively in PowerPoint or Google Slides, or prompt your AI and the chart lands on the open slide. Fourteen chart types, still editable next month.
 NetherlandsEU


Transforms collected data from Excel and SPSS into visual PowerPoint reports, automates updates with new data, supports advanced charting, conditional analysis, team collaboration, secure sharing, and ensures the latest analytics sync seamlessly with the presentation workspace.
United States


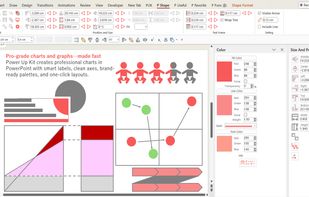
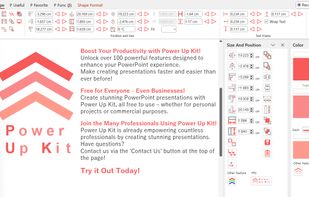
PowerUpKit is a free Microsoft PowerPoint add-in (PPAM) for Windows that delivers more than 100 productivity Features to accelerate everyday slide design and maintenance. It focuses on the repetitive actions consultants, analysts, instructors, and creators perform dozens of...
 Japan


Productivity add-ins for MS Excel and MS PowerPoint


