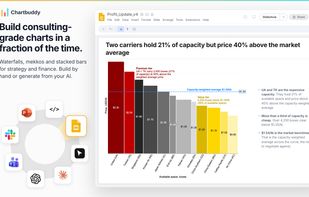
Chartbuddy builds consulting-grade charts in a fraction of the time. Waterfalls, mekkos and stacked bars for strategy and finance, built by hand or generated from your AI. It works four ways.
Build and edit charts natively in the deck. Create and edit charts on the canvas in PowerPoint or Google Slides. Reopen any chart next month and change the numbers instead of rebuilding it. Any colleague with Chartbuddy installed can edit it. In Google Slides, link a chart to a Google Sheets range and a recurring deck updates from live data.
Generate it with your AI, edit it in the deck. Prompt Claude Code, Codex, Cursor, Claude Desktop or Antigravity and the chart lands on your open slide, ready to edit. That connection is Hub, a desktop app for Mac and Windows. It runs locally, so your numbers stay on your machine.
Build an HTML dashboard where the charts stay alive. Ask Claude or ChatGPT for a dashboard or an HTML deck and every chart comes out editable. Click any chart to change its colors, axis or number format, then drag it into your deck. That is Embed, a JavaScript package.
Ask your analytics agent and get the deck, not just the answer. Ask in Slack, Teams or WhatsApp and the answer comes back in the thread. Ask for the deck and it opens in PowerPoint or Google Slides with charts you can keep editing.
Fourteen chart types, including the waterfall, bar mekko and marimekko that native deck charting does not cover, plus combo, 100% stacked bar and bubble. Control axes, axis breaks, number formats, labels, annotations and smart arrows for growth and CAGR. Point and click, no code. Set your organization colors and font once and every chart uses them by default.
Free gives you 10 free sessions with no credit card, roughly three hours of charting each. Pro is 10 euro or 12 dollars per seat per month for teams of 1 to 10, one subscription for PowerPoint and Google Slides. Enterprise above 10 seats adds SAML SSO, SCIM and priority support. Hub and Embed are included on every plan.
Built for consultants, private equity and investment banking teams, and corporate strategy and finance teams. SOC 2 Type II certified, GDPR aligned, OAuth 2.0. Rated 4.9/5 on G2. Built in Amsterdam by two ex-Monitor Deloitte consultants.
Get started from the website link on this page.






 EU
EU


 ChartKit added Chartbuddy as alternative to ChartKit
 Chartbuddy BV


No comments or reviews, maybe you want to be first?