





ChartKit
Like
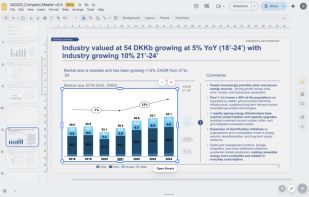
Build consultant-grade charts — waterfalls, stacked bars, variance bridges — natively inside Google Slides, Docs and Sheets. A think-cell alternative for teams on Google Workspace.

Cost / License
- Freemium (Subscription)
- Proprietary
 EU
EUPlatforms
- Online
- Google Chrome


Features
Highlights All activities
ChartKit News & Activities
Recent activities
- ChartKit added ChartKit
- Paul updated ChartKit
 ChartKit added ChartKit as alternative to think-cell chart, Deckary, empower® Suite, ChartEngine for Excel and 11 more

Developed by
 ChartKit
 Licensing
Proprietary and Freemium product.Pricing
Subscription ranging between $4 and $8 per month + free version with limited functionality.Alternatives
15 alternatives listedBadge
Get an embeddable badge for ChartKitSupported Languages


No comments or reviews, maybe you want to be first?