


Koolcharts provides charting solutions with full HTML5 support. It renders data using a number of sliding effects, you can choose whichever effect you want and set an amount of time for a sliding effect.
Cost / License
- Paid
- Proprietary
Platforms
- Online
- JavaScript
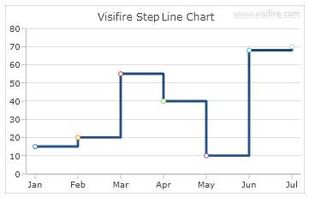
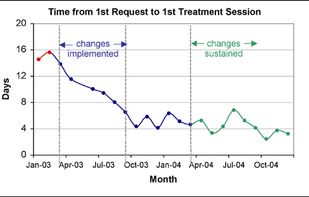
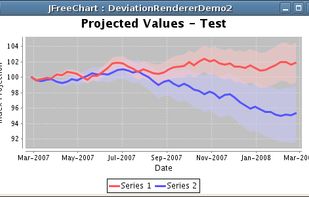 +3
+3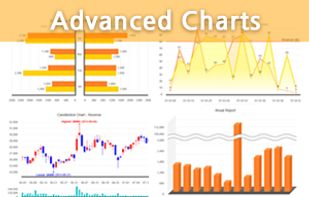

Cost / License
- Free
- Open Source
Application type
Platforms
- Self-Hosted
 +1
+1

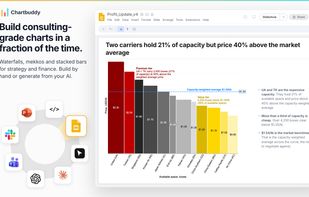
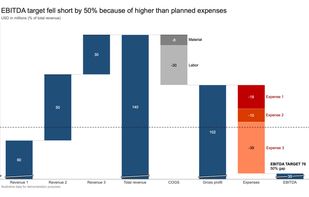
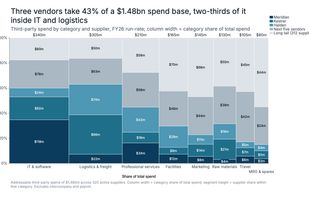
Build waterfalls, mekkos and stacked bars natively in PowerPoint or Google Slides, or prompt your AI and the chart lands on the open slide. Fourteen chart types, still editable next month.
Cost / License
- Freemium
- Proprietary
Platforms
- Google Chrome
- Microsoft PowerPoint
- Software as a Service (SaaS)
 Netherlands
 EU
EU
 +5
+5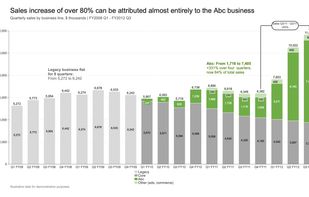 Best alternatives are6 alternatives


