

zornade studio icon
zornade studio icon

zornade studio

Free no-code editor for interactive maps and data visualizations: choropleth, points, cartograms, flow maps, with built-in Italian geo-joins, published as responsive embeds.
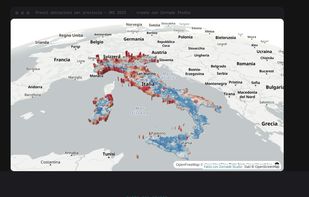
zornade studio screenshot 1

Cost / License

Application type

Platforms

  • Online
2likes
0comments
0articles

Features

Properties

  1.  Privacy focused

Features

  1.  Points of Interest (POI)
  2.  Ad-free
  3.  No Tracking
  4.  No registration required
  5.  Based on OpenStreetMap
  6.  Data visualization

zornade studio News & Activities

Highlights All activities

Recent activities

zornade studio information

  • Developed by

    IT flagzornade
  • Licensing

    Open Source (AGPL-3.0) and Free product.
  • Written in

  • Alternatives

    9 alternatives listed
  • Supported Languages

    • English
    • Italian

AlternativeTo Category

Travel & Location

GitHub repository

  •  0 Stars
  •  0 Forks
  •  0 Open Issues
  •   Updated  
View on GitHub
zornade studio was added to AlternativeTo by alternativeto-refining347 on and this page was last updated .
No comments or reviews, maybe you want to be first?

What is zornade studio?

Zornade Studio is a step-by-step, no-code editor (data ? structure ? visualize ? design ? publish) for turning a CSV, geographic file, or public dataset into a polished interactive map or chart ready to embed in an article, with correct data attribution and customizable styling, no design or GIS skills required.

Data sources: file upload (CSV, GeoJSON, zipped Shapefile, KML/KMZ, Excel), pasted tables, remote CSV/GeoJSON URLs, live OpenStreetMap queries (via Overpass), and preloaded statistical/ISTAT and Eurostat catalogs.

Visualization types: choropleth maps, point/marker maps, bivariate maps, cartograms (contiguous and non-contiguous), hexbin and heatmaps, origin-destination flow maps, charts (bar, line, scatter), tables, time-series with a time slider, scrollytelling (step-by-step narrative maps with animated camera), and a 3D globe view.

What sets it apart: automatic geographic joins for Italian administrative levels (postal code/CAP, municipality, province, region) plus integrated OpenStreetMap data, a data-journalism and public-sector workflow that usually requires manual GIS work in generic map builders.

Publishing: every map is published as a lightweight, responsive static HTML embed (<iframe>), with data attribution (OpenStreetMap/ODbL) built in and non-removable.

Built for: newsrooms, data journalists, researchers, public administrations, and anyone who needs to turn a geographic or statistical dataset into a clear visual story in a few hours, not days.

License: dual-licensed AGPL-3.0 (source available, self-hostable) with a commercial license option for closed-source/SaaS use. Free to use on the hosted version.

Official Links