Comprehensive spreadsheet tool offering advanced data management with features like pivot tables, data visualization, and customizable charts for professional use in creating detailed reports and analyses.
 United States


Apps similar to AnswerMiner include Microsoft Excel. It's paid, but Gephi and RAWGraphs are free. Other options are Metabase, Tableau, Microsoft Power BI and Retool. There's no shortage of Business Intelligence Tools like AnswerMiner, with more than 100 alternatives for the web, Windows, Mac, self-hosting and iPhone.
Comprehensive spreadsheet tool offering advanced data management with features like pivot tables, data visualization, and customizable charts for professional use in creating detailed reports and analyses.
United States
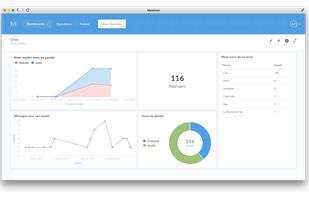
Metabase is a simple and powerful analytics tool which lets anyone learn and make decisions from their company’s data. No technical knowledge required! We hope you love it.
United States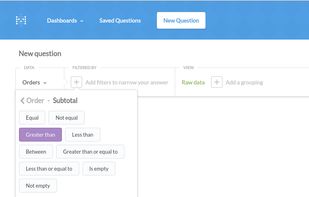


Gephi is the leading visualization and exploration software for all kinds of graphs and networks. Gephi is open-source and free.
 France
 EU


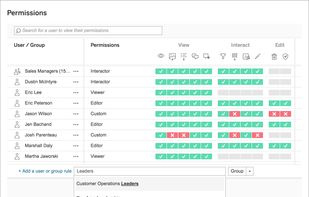
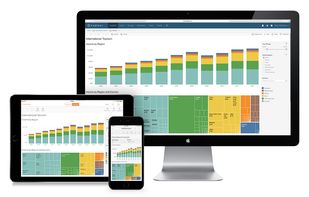
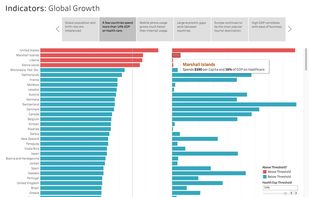
Tableau helps the world’s largest organizations unleash the power of their most valuable assets: their data and their people.
United States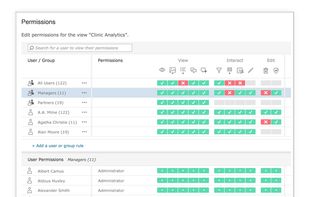


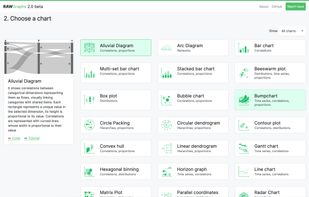
RAWGraphs is an open source app built with the goal of making the visualization of complex data easy for everyone. Born as tool for designers and vis geeks, RAWGraphs aims at providing a missing link between spreadsheets and vector graphics editors.
 ItalyEU


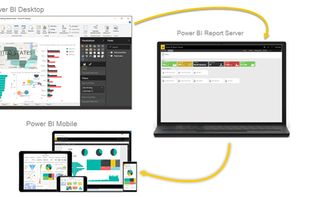
Utilize Microsoft's Power BI to convert varied data sources into interactive visual insights. It includes Power BI Desktop, online services, and mobile apps, allowing the creation, sharing, and consumption of business insights on any device, tailored to diverse business needs.
United States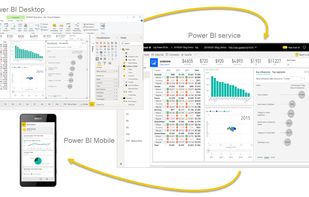

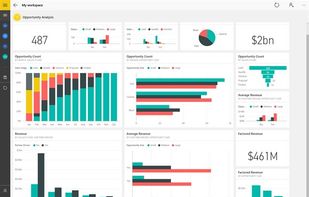


Your business needs software. But because engineers are scarce, many departments (sales, marketing, support, HR, etc.) don’t build the software they need. When companies use Retool, they build much more software, which leads to a more efficient business.
United States


Plotly is the easiest way to graph and share data online. Open-source libraries for JavaScript (comparison with HighCharts at https://plot.ly/highcharts-alternative/), Python, R, and MATLAB.
United States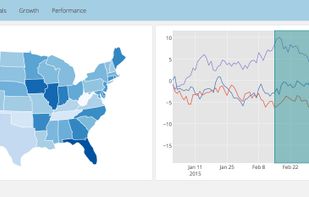
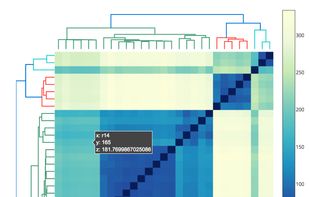
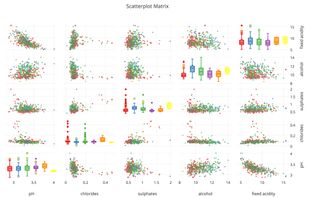


A real-time global intelligence dashboard that aggregates live flight tracking, CCTV networks, earthquake monitoring, conflict zone mapping, and 24/7 news feeds into a single GPU-accelerated interface.
 Canada



Centralizes metrics and KPIs by connecting 130+ data sources, preparing and merging data, providing real-time dashboards, benchmarks, forecasting, auto-updating reports, AI insights, goal tracking, deep analysis tools, and easy sharing for team decision-making.
United States


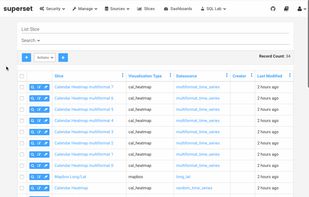
Modern, enterprise-ready business intelligence web application.
United States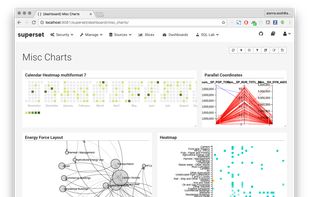


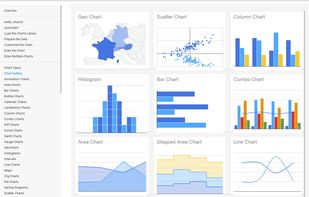
The Google Charts is an extremely simple tool that lets you easily create a chart from some data and embed it in a webpage. You embed the data and formatting parameters in an HTTP request, and Google returns a PNG image of the chart.
United States