Apps with 'Data visualization' feature Page 9 of 27

All apps in Apps with 'Data visualization' feature category. Use the filters below to narrow down your search. 
Copy a direct link to this comment to your clipboard
  1. Ona icon
     4 likes

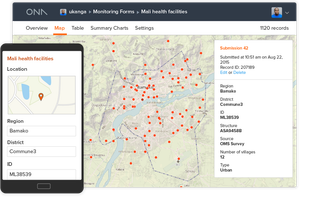
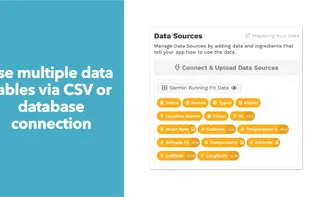
    Ona is a mobile data collection and data visualizations platform that allows for offline/online data collection on any device. Securely manage and visualize your data using charts, tables, and the beautiful map views.

    Cost / License

    • Freemium
    • Proprietary

    Platforms

    • Mac
    • Windows
    • Linux
    • Online
    • Android
    • iPhone
    • Chrome OS
    • Android Tablet
    • Windows Phone
    • iPad
    • Self-Hosted
    • Blackberry 10
    Ona screenshot 1
    10 alternatives
  2. CompactView icon
     2 likes

    CompactView is a viewer for Microsoft® SQL Server® Compact Edition (SQLCE) database files (*.sdf).

    Cost / License

    • Free
    • Open Source

    Platforms

    • Windows
    • .NET Framework
    CompactView screenshot 1
    4 alternatives
  3. Dxyfer icon
     Like

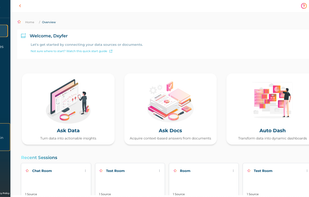
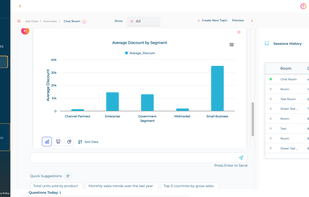
    Dxyfer is a cloud-based ‘Augmented Intelligence’ platform offered as Software as a Service (SAAS), revolutionizing business Intelligence and data analysis by leveraging sophisticated purpose-built machine learning algorithms and language learning models.

    Cost / License

    • Free Personal
    • Proprietary

    Platforms

    • Google Drive
    • MariaDB
    • Google Sheets
    • Microsoft SQL Server
    • PostgreSQL
    • Microsoft Excel
    Dxyfer Dashboard
    AskData
    AutoDash
  4. Vizydrop icon
     4 likes

    Explore data from apps and sources you are using in a visual way. It takes no effort. One single place, the natural way, all for free.

    Cost / License

    • Free Personal
    • Proprietary

    Platforms

    • Online
    Vizydrop screenshot 1
    Vizydrop screenshot 1
    Vizydrop screenshot 2
    +7
    Vizydrop screenshot 3
    14 alternatives
  5. Viur icon
     4 likes

    Viur allows you to do business analytics on top of your operational databases (also CRM, ERP databases), cloud services and files. It's a Business Intelligence tool that anyone can use.

    Cost / License

    • Paid
    • Proprietary

    Platforms

    • Online
    • Self-Hosted
    It works in all kinds of devices
    28 alternatives
  6. Vega is a visualization grammar, a declarative format for creating, saving, and sharing interactive visualization designs. With Vega, you can describe the visual appearance and interactive behavior of a visualization in a JSON format, and generate web-based views using Canvas or...

    Cost / License

    Application type

    Platforms

    • Online
    • Self-Hosted
    Vega Visualization Grammar screenshot 1
    3 alternatives
  7. FineReport icon
     2 likes

    FineReport is a powerful and efficient reporting tool allows you to creat complex reports with no IT help and supports a wide variety of data sources. It has an easy-to-use Excel-analogous designer and rich visual effects.

    Cost / License

    • Paid
    • Proprietary

    Platforms

    • Mac
    • Windows
    • Android
    • iPhone
    • iPad
    FineReport screenshot 1
    FineReport screenshot 1
    FineReport screenshot 2
    +9
    FineReport screenshot 3
    16 alternatives
  8. Iris AI icon
     2 likes

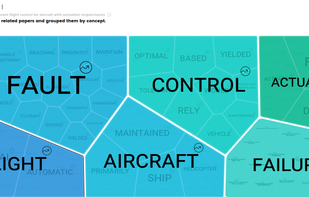
    Iris AI will analyze the abstract of your research paper, present the key concepts, and link those with research papers. Use the tool at https://the.iris.ai

    Cost / License

    • Free
    • Proprietary

    Platforms

    • Online
    Iris AI screenshot 1
    Iris AI screenshot 1
    2 alternatives
  9. Alteryx icon
     4 likes

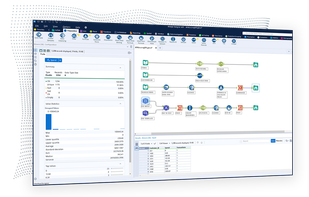
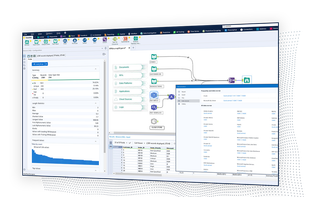
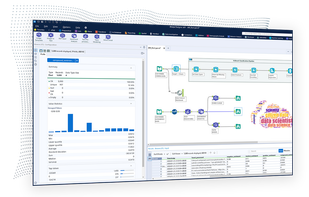
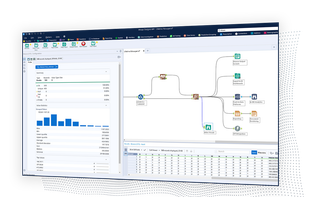
    Automates analytics from prep to science with a drag-and-drop interface, offering low- or no-code options for data profiling, enrichment, and insights.

    Cost / License

    • Paid
    • Proprietary

    Platforms

    • Windows
    • Online
    • Software as a Service (SaaS)
    Alteryx screenshot 1
    Alteryx screenshot 1
    Alteryx screenshot 2
    +2
    Alteryx screenshot 3
  10. EasyMorph icon
     5 likes

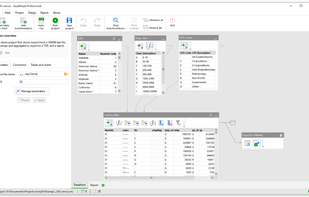
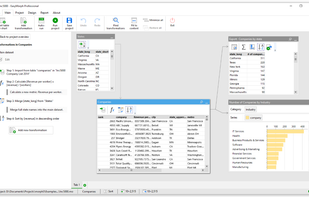
    The task of data transformation is traditionally believed to belong to IT developers while business users are typically left with Excel, or cumbersome Visual Basic and Python scripting. Although there have been attempts to create easy-to-use so-called data preparation utilities...

    Cost / License

    • Freemium
    • Proprietary

    Platforms

    • Windows
    EasyMorph screenshot 1
    EasyMorph screenshot 1
    EasyMorph screenshot 2
    +1
    EasyMorph screenshot 3
    22 alternatives
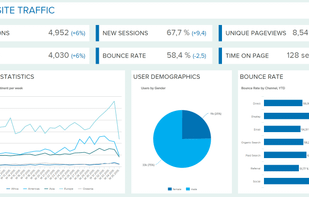
  11. A business intelligence tool that includes ad hoc reporting, self-service data visualization and dashboards, predictive analytics, mobile apps, and more.

    Cost / License

    • Paid
    • Proprietary

    Platforms

    • Windows
    • Android
    • iPhone
    • Android Tablet
    • iPad
    SAP BusinessObjects screenshot 1
    SAP BusinessObjects screenshot 1
    SAP BusinessObjects screenshot 2
    +3
    SAP BusinessObjects screenshot 3
    28 alternatives
  12.  3 likes

    An open-source non-profit personal data visualization framework to help you make sense of your life and compare hypotheses about what affects your well-being.

    Cost / License

    • Free
    • Open Source

    Platforms

    • Online
    6 alternatives
  13. Circos icon
     4 likes

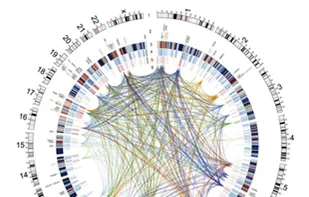
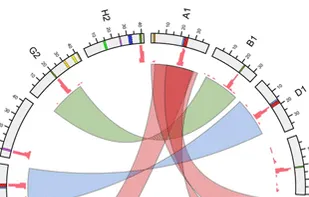
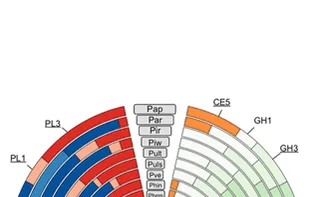
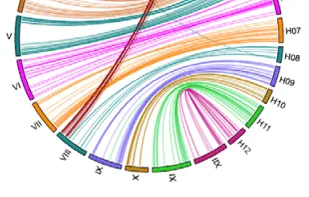
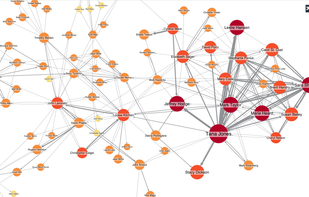
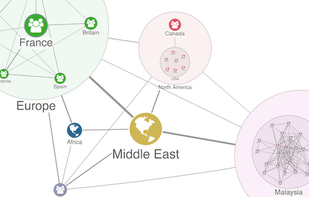
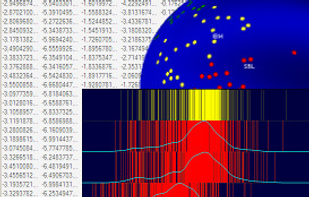
    Circos is a software package for visualizing data and information. It visualizes data in a circular layout — this makes Circos ideal for exploring relationships between objects or positions. There are other reasons why a circular layout is advantageous, not the least being the...

    Cost / License

    • Free
    • Open Source

    Application type

    Platforms

    • Mac
    • Windows
    • Linux
    Circos screenshot 1
    Circos screenshot 1
    Circos screenshot 2
    +11
    Circos screenshot 3
    44 alternatives
  14. Spotfire icon
     4 likes

    The TIBCO Spotfire Enterprise Analytics platform offers a radically faster business intelligence experience and is far more adaptable to specific industry and business challenges than traditional alternatives.

    Cost / License

    • Paid
    • Proprietary

    Platforms

    • Windows
    Spotfire screenshot 1
    3d-scatter plot + heatmap
    39 alternatives
  15. Chartmetric icon
     2 likes

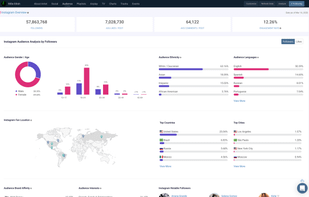
    Insights for music professionals with data from multiple music streaming services, social media platforms, and radio stations. Analyze and track cross-platform performance, similar artists/playlists/curators, audience demographics, charts, and more.

    Cost / License

    • Freemium
    • Proprietary

    Platforms

    • Software as a Service (SaaS)
    Chartmetric screenshot 1
    Chartmetric screenshot 1
    Chartmetric screenshot 2
    +26
    Chartmetric screenshot 3
    1 alternatives
  16. BAG·Tower icon
     3 likes

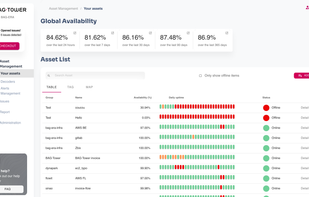
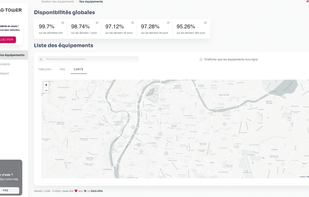
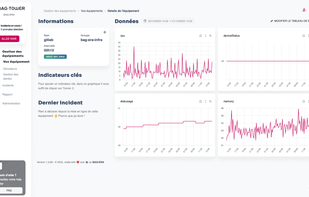
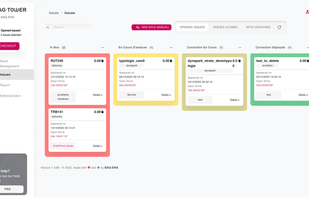
    BAG·Tower is a SaaS platform to monitor equipment, connected objects, applications, services, etc. BAG·Tower's simple interface that can be used by anyone on your team: developers, team managers, analysts or simple guests.

    Cost / License

    • Paid
    • Proprietary

    Platforms

    • Online
    Overview off all assets
    View Map of assets (equipment)
    Incident details (Data visualization)
    +5
    Incidents management
    9 alternatives
  17. datapine icon
     7 likes

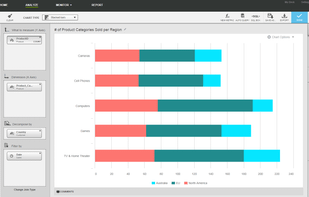
    datapine enables people to explore, visualize and share data in one central analytics platform, that offers smart data connectors, a wealth of advanced BI 4.0 features and interactive dashboards.

    Cost / License

    • Paid
    • Proprietary

    Platforms

    • Mac
    • Windows
    • Online
    • Android
    • iPhone
    • Android Tablet
    • iPad
    • Software as a Service (SaaS)
    datapine screenshot 1
    datapine screenshot 1
    datapine screenshot 2
    +1
    datapine screenshot 3
    59 alternatives
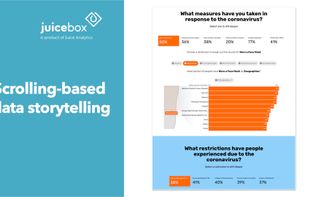
  18. Create beautiful data visualizations that make you look like a pro. Juicebox is a data visualization platform for consultants and information workers who want to impress with their next data-rich presentation or data story.

    Cost / License

    • Free
    • Proprietary

    Platforms

    • Online
    Juice Analytics screenshot 1
    Juice Analytics screenshot 1
    Juice Analytics screenshot 2
    +5
    Juice Analytics screenshot 3
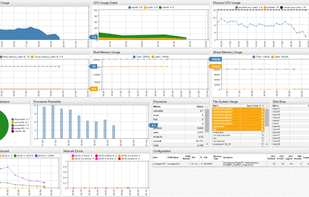
  19. ATSD is purpose-built for analyzing and reporting on massive volumes of time-series data collected at high frequency. Features include data analytics, visualization, data forecasting, reporting, alerting. All in one product built for big data.

    Cost / License

    • Free
    • Proprietary

    Platforms

    • Linux
    • Self-Hosted
    ATSD Visualization Portal Example
    26 alternatives
  20. ReportServer icon
     8 likes

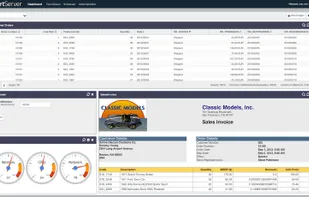
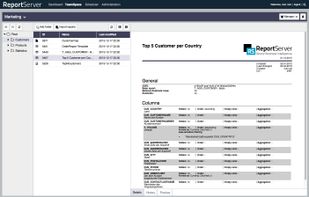
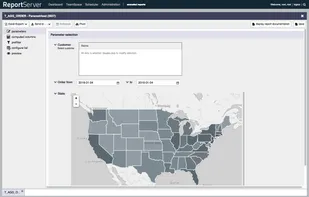
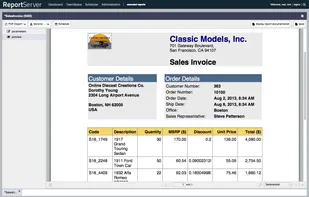
    ReportServer is a web-based business intelligence platform that offers everything you need to evaluate your business. ReportServer comes with powerful ad-hoc analysis tools as well as with support for OLAP and pixel-perfect reporting.

    Cost / License

    • Free
    • Open Source

    Platforms

    • Mac
    • Windows
    • Linux
    • Online
    • Self-Hosted
    ReportServer Dashboards
    The TeamSpace
    ReportServer parameters
    +4
    Pixel-perfect Reporting
    19 alternatives
  21. Lampyre icon
     1 like

    Lampyre - an efficient data analysis and OSINT multi-tool for everyone. Obtain, visualize and analyze data in one place to see what others can't.

    Cost / License

    • Freemium
    • Proprietary

    Alerts

    • Warning

    Platforms

    • Windows
    Lampyre screenshot 1
    13 alternatives
  22. VisuMap icon
     2 likes

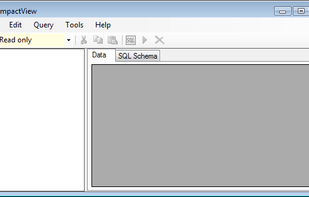
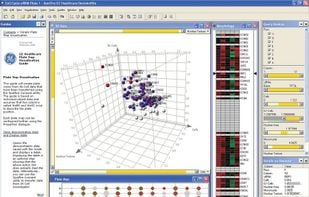
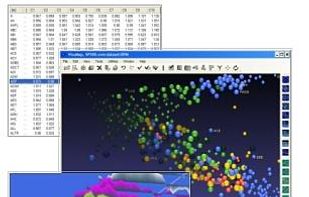
    VisuMap is a software application for exploratory data analysis, it helps people to explore and understand high dimensional data, e.g. tables with 10 to 10000 columns/attributes. VisuMap offers a set of MDS (multidimensional scaling) and data clustering services with a pallet of.

    Cost / License

    • Paid
    • Proprietary

    Platforms

    • Windows
    VisuMap screenshot 1
    VisuMap screenshot 1
    2 alternatives
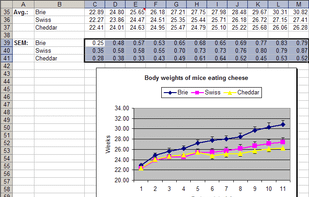
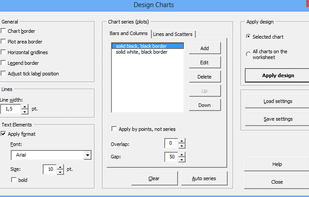
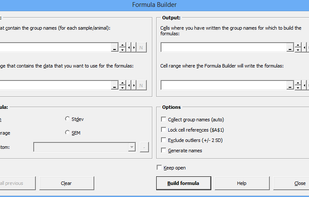
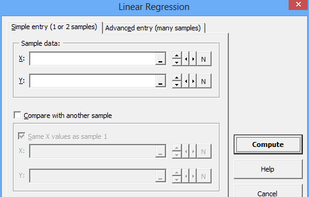
  23. Daniel’s XL Toolbox is a free, open-source add-in for the Microsoft Excel spreadsheet software that helps you to analyze and present data and increases your productivity. Its target audience are life scientists, but it has proven useful for industry as well.

    Cost / License

    • Free
    • Open Source

    Platforms

    • Windows
    • Microsoft Office Excel
    Chart after using the error bar function
    Chart design dialog
    Formula builder
    +1
    Simple linear regression dialog
    18 alternatives