Apps with 'Data visualization' feature Page 10 of 27

All apps in Apps with 'Data visualization' feature category. Use the filters below to narrow down your search. 
Copy a direct link to this comment to your clipboard
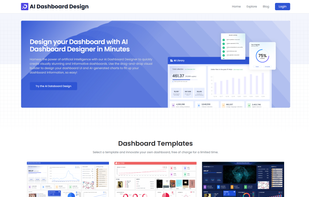
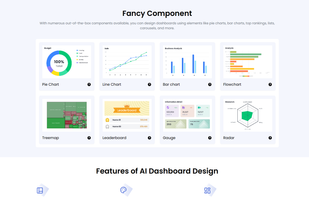
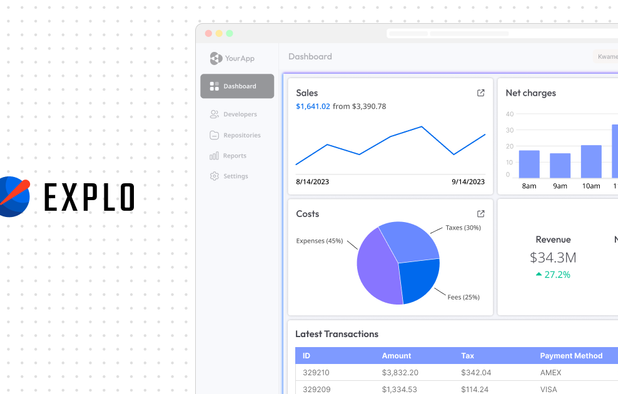
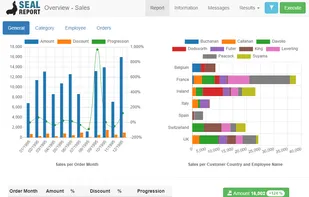
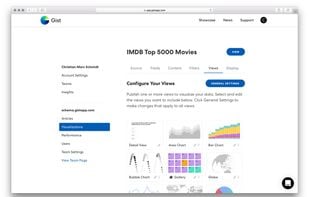
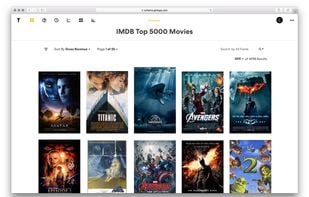
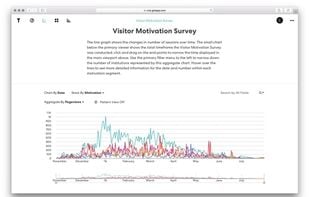
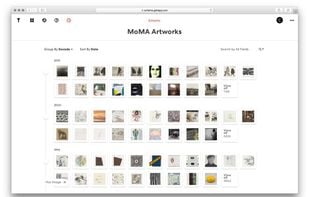
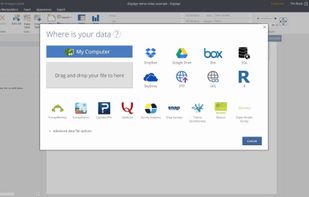
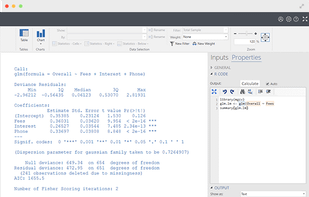
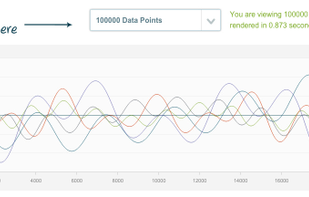
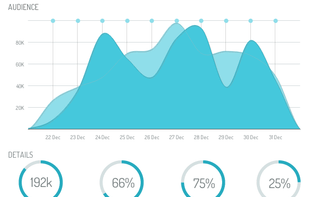
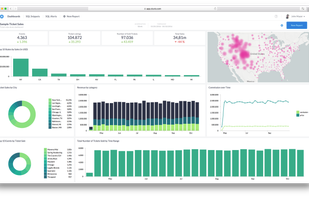
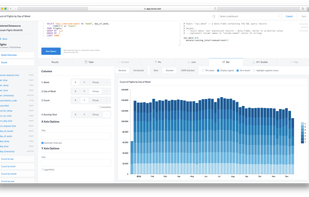
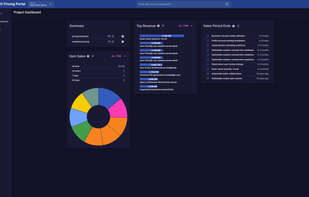
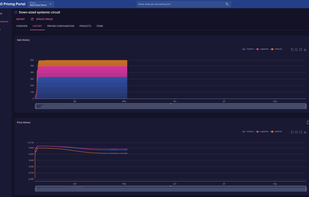
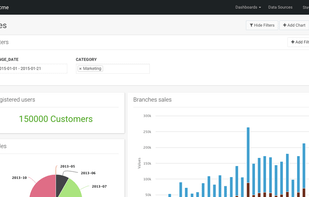
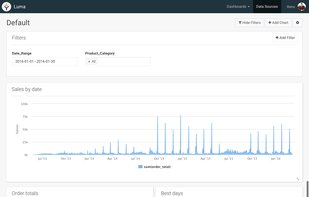
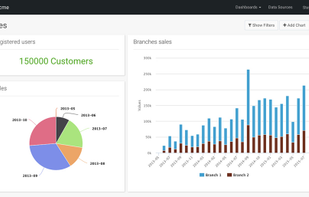
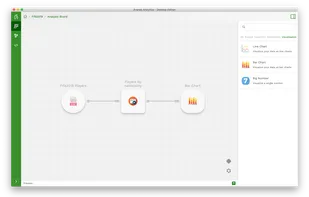
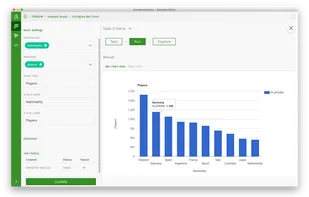
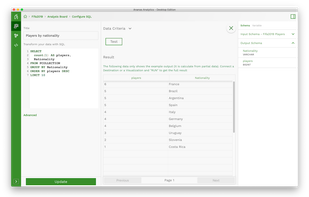
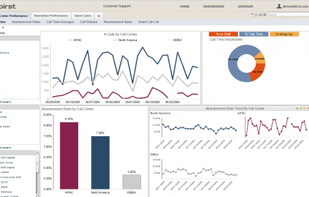
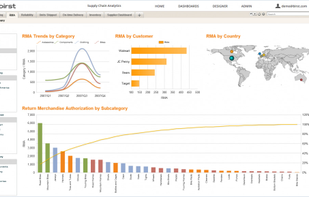
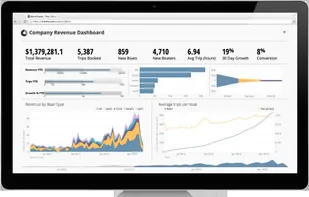
  1. Dashboard Design is a powerful platform that allows you to easily build custom dashboards or databoards using AI-driven tools and a robust graph maker. Whether you need to design pie charts, bar graphs, flowcharts, or complex data visualizations, this tool simplifies the process.

    Cost / License

    • Free
    • Proprietary

    Platforms

    • Online
    AI Dashboard Design screenshot 1
    AI Dashboard Design screenshot 1
    AI Dashboard Design screenshot 2
  2. Chartello icon
     1 like

    Uncover trends in the data you have been collecting all along. Automatically generate charts from your live database without writing code.

    Cost / License

    • Paid
    • Proprietary

    Platforms

    • Online
    • Software as a Service (SaaS)
    Chartello screenshot 1
    Chartello screenshot 1
    32 alternatives
  3. Smashrun icon
     3 likes

    Smashrun is a data visualization platform for runners. It helps uncover interesting correlations between training habits and performance over time and it's super easy to use! Smashrun combines basic run metrics alongside advanced charts and graphs to provide both a "big...

    Cost / License

    • Freemium
    • Proprietary

    Application type

    Platforms

    • Online
    Smashrun screenshot 1
    Smashrun screenshot 1
    35 alternatives
  4. Nagios Log Server is a powerful enterprise-class log monitoring and management application that allows organizations to quickly and easily view, sort, and configure logs from any source on any given network.

    Cost / License

    • Paid
    • Proprietary

    Platforms

    • Windows
    • Linux
    • Online
    • Self-Hosted
    Nagios Log Server
    Nagios Log Analysis
    Cluster status
    +4
    Alerting on Log Messages
    68 alternatives
  5. The web service provides statistics describing color characteristics of an image identified by URL. Summary data indicate the single RGB color that best represents the image, along with average hue and saturation values and RGB and HSV histograms.

    Cost / License

    • Free
    • Proprietary

    Platforms

    • Online
    Image Color Summarizer screenshot 1
    Image Color Summarizer screenshot 1
    19 alternatives
  6. Seal Report icon
     4 likes

    Seal Report offers a complete framework for producing daily reports from any database or any No SQL source. The product focuses on easy installation and report design: Once setup, reports can be built and published in a minute.

    Cost / License

    • Free
    • Open Source

    Platforms

    • Windows
    HTML Report Result
    Report Designer
    Web Report Server
    +2
    Report Result with Responsive Layout
    17 alternatives
  7. Veles icon
     2 likes

    Binary data analysis and visualization tool.

    Cost / License

    Alerts

    • Discontinued

    Platforms

    • Mac
    • Windows
    • Linux
    Veles screenshot 1
    hex editor and node tree
    trigrams visualization
    +1
    layered cylindrical bigram visualization
    13 alternatives
  8. Pixpro icon
     9 likes

    Pixpro is a photogrammetric software targeted at solving surveying challenges and facilitating multiple on-site and off-site work stages.

    Cost / License

    • Paid
    • Proprietary

    Application type

    Platforms

    • Windows
    • Online
    Pixpro GUI - measurements and calculations
    2D to 3D - model reconstruction
    29 alternatives
  9. Gist icon
     3 likes

    Use Gist to create simple, beautiful data applications that enable individuals and teams to explore datasets, extract knowledge, and share insights.

    Cost / License

    Platforms

    • Online
    • Self-Hosted
    Gist screenshot 1
    Gist screenshot 1
    Gist screenshot 2
    +1
    Gist screenshot 3
    12 alternatives
  10. TalktoData is Your 24/7 AI Data Analyst. Unlock insights effortlessly with TalktoData. No coding, no hassle—just connect your spreadsheets or SQL databases and ask your data questions. Get real-time answers and visualizations, anytime you need them.

    Cost / License

    • Freemium
    • Proprietary

    Platforms

    • Online
    AI Assistant analysing the data and Generating Visualisations
    AI Assistant auto suggesting next logical questions for exploratory Data Analysis
    4 alternatives
  11. Displayr icon
     2 likes

    Displayr is online data science and data analytics software. It was created so smart people could do their own data science: explore, model, visualize and report. One app for everything. Easy for novices, powerful for experts.

    Cost / License

    • Paid
    • Proprietary

    Application type

    Platforms

    • Online
    Displayr screenshot 1
    Displayr screenshot 1
    Displayr screenshot 2
    +3
    Displayr screenshot 3
    11 alternatives
  12. Tom Sawyer Software is the leader in graph visualization and analysis software. We help you gain new understanding from your data and enhance your applications.

    Cost / License

    • Paid
    • Proprietary

    Platforms

    • Mac
    • Windows
    • Online
    12 alternatives
  13. ZingChart icon
     11 likes

    ZingChart is a JavaScript charting library with no dependencies that is built for big data. The library can handle huge data sets without breaking, crashing, or sacrificing interactivity. As a dependency-free library, no additional plugins are required.

    Cost / License

    • Paid
    • Proprietary

    Application type

    Platforms

    • Online
    larger data set rendered with ZingChart.
    ZingChart allows very flexible styling to match any custom design.
    Many chart types available all in one package, including piano or heat map charts. Here, shown with tooltips.
    +4
    Maps are included in the library and can be given interactive features through the API.
    32 alternatives
  14. Grow icon
     8 likes

    Grow is a cloud BI app that allows businesses to centralize data, build metrics, create dashboards, and track their success in real-time.

    Cost / License

    • Paid
    • Proprietary

    Platforms

    • Android
    • iPhone
    • Android Tablet
    • iPad
    • Software as a Service (SaaS)
    Grow screenshot 1
  15. Tide icon
     2 likes

    Tide is a beautifully designed, modern social media aggregator. Nothing is more important to us than great design, and the current tweet walls just didn't cut it - so we made our own. Whether projecting to delegates or embedding in your website we have a solution for you.

    Cost / License

    • Paid
    • Proprietary

    Platforms

    • Online
    Tide screenshot 1
  16. QueryTree icon
     3 likes

    QueryTree is a flexible and powerful database reporting tool. Simply connect your database and start visualizing your data in minutes. Everything works with a dropdown menu interface - no code or SQL needed.

    Cost / License

    Platforms

    • Windows
    • Online
    • Self-Hosted
    A simple visualization that you can create on mobile or tablet
    The simple report builder
    Schedule reports
    +3
    Invite team members
  17. Cluvio icon
     2 likes

    Cluvio is the #1 cloud BI platform for startups and data-driven teams, trusted by over 300 companies. Use SQL and R to analyze your data and in few minutes create beautiful, interactive dashboards for your entire company.

    Cost / License

    • Paid
    • Proprietary

    Platforms

    • Mac
    • Windows
    • Linux
    • Online
    • Android
    • iPhone
    • iPad
    • Self-Hosted
    • Software as a Service (SaaS)
    Cluvio screenshot 1
    Cluvio screenshot 1
    59 alternatives
  18. DynamO is a technology company providing fully automated, demand-based dynamic pricing tool for venues and event organizers to boost revenue, sell-out all the tickets and reduce time spent on pricing.

    Cost / License

    • Paid
    • Proprietary

    Platforms

    • Software as a Service (SaaS)
    DynamO Pricing screenshot 1
    DynamO Pricing screenshot 1
    DynamO Pricing screenshot 2
    +1
    DynamO Pricing screenshot 3
  19. The Google Ngram Viewer is an online phrase-usage graphing tool originally developed by Jon Orwant and Will Brockman of Google, inspired by a prototype (called "Bookworm") created by Jean-Baptiste Michel and Erez Aiden from Harvard and Yuan Shen from MIT.

    Cost / License

    • Free
    • Proprietary

    Platforms

    • Online
    Google Ngram Viewer screenshot 1
  20. Ananas Analytics Desktop is a hackable data tool that helps your team combining non-technical and technical users to collaborate and build data analytics faster. Connect data from anywhere. Transform, analyze, and visualize to build analytics in minutes.

    Cost / License

    Alerts

    • Discontinued

    Platforms

    • Mac
    • Windows
    • Linux
    Ananas Desktop screenshot 1
    Ananas Desktop screenshot 1
    Ananas Desktop screenshot 2
    7 alternatives
  21. Many Eyes icon
     1 like

    Many Eyes is a free site by IBM Research which focus on visualising data.

    Cost / License

    • Free
    • Proprietary

    Alerts

    • Discontinued

    Platforms

    • Online
    18 alternatives
  22. Birst icon
     3 likes

    Enterprise-caliber BI delivers accurate, actionable content in an intuitive, self-service environment. It allows users to combine data from different source systems to get answers to their most pressing business concerns in real time.

    Cost / License

    • Paid
    • Proprietary

    Platforms

    • Online
    Visualisation
    Analysis
    95 alternatives