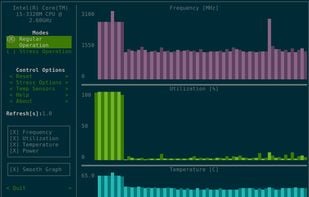
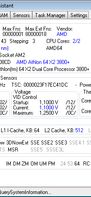
AMD64 CPU Assistant monitors the temperature of AMD64 CPU cores (AMD64 K8 processor on Socket 754/S1/940/F1207/939/AM2/ASB1/S1g1) using the on-die thermal sensor.
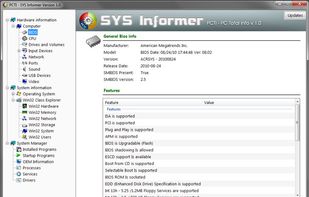
- System Information Utility
- Free • Proprietary
- Windows
Best alternatives are  CPU-Zand
 HWiNFO (32/64)
34 alternativesCPU-ZandHWiNFO (32/64)