Apps with 'Data visualization' feature Page 16 of 33

All apps in Apps with 'Data visualization' feature category. Use the filters below to narrow down your search. 
Copy a direct link to this comment to your clipboard
  1. SEOLinkMap icon
     1 like

    SEOLinkMap reveals both the hierarchy AND semantic relationships of your website simultaneously - showing you not just how users navigate, but how content connects.

    Cost / License

    • Freemium (Pay once or Subscription)
    • Proprietary

    Application type

    Since

    • Since 2025

    Platforms

    • Software as a Service (SaaS)
    • US flagUnited States
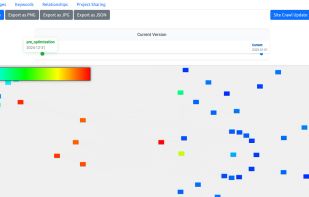
    Internal Link Visualization with Relevance Clusters
  2. Professional-grade cryptocurrency market analysis and volatility tracking tool. Identify high-growth 'Hot Spots' and market trends in real-time with the proprietary Crypto-Cracker dashboard.

    Cost / License

    • Free
    • Proprietary

    Since

    • Since 2026

    Platforms

    • Online
    • IE flagIreland
    • European Union flagEU
    CryptoCracker screenshot 1
    1 alternative
  3. PlotsALot icon
     1 like

    A data visualization tool that converts natural language queries into visual representations of data. It processes datasets to extract meaningful patterns, presenting them through appropriate charts and graphs.

    Cost / License

    • Freemium (Subscription)
    • Proprietary

    Since

    • Since 2025

    Platforms

    • Online
    PlotsALot screenshot 1
  4. Jolicharts icon
     2 likes

    Jolicharts is a new way to build charts connected to your data and embed them into your app.

    Cost / License

    • Paid
    • Proprietary

    Since

    • Since 2013

    Platforms

    • Online
    Jolicharts is a new way to build charts connected to your data and embed them into your app.
    24 alternatives
  5. BioSciTools icon
     1 like

    BioSciTools (Bioinformatics Science Tools), a desktop program developed based on Java 11, aims to make new exploration and contribution to the development of bioinformatics, and realize data analysis and visualization in the fields of sequence analysis, multi-omics...

    Cost / License

    • Free
    • Open Source (MIT)

    Application type

    Since

    • Since 2023

    Platforms

    • Windows
    BioSciTools-Home
    BioSciTools-DNA
    BioSciTools-Stat
    +2
    BioSciTools-Genomics
  6. Gravwell icon
     4 likes

    Gravwell is an all-you-can-ingest data fusion analytics platform that enables complete context and root cause analytics for security and business data.

    Cost / License

    • Freemium (Subscription)
    • Proprietary

    Since

    • Since 2019

    Platforms

    • Linux
    • Online
    • Software as a Service (SaaS)
    • Self-Hosted
    • US flagUnited States
    Gravwell screenshot 1
    Gravwell screenshot 1
    Gravwell screenshot 2
    Gravwell screenshot 3
    17 alternatives
  7. Dataddo icon
     2 likes

    Dataddo is a cloud-based data integration, automation and transformation platform designed to work with any online data service such as HubSpot, Salesforce, Google Analytics, Facebook or Instagram. Dataddo easily connects all of the client's data with their BI, dashboards...

    Cost / License

    • Subscription
    • Proprietary

    Since

    • Since 2015

    Platforms

    • Online
    • CZ flagCzechia
    • European Union flagEU
    Dataddo screenshot 1
    Dataddo screenshot 1
    Dataddo screenshot 2
    +1
    Dataddo screenshot 3
    2 alternatives
  8. Whaly icon
     1 like

    Whaly lets business teams build analysis & reports on top of their everyday tools (Hubspot, Postgres, Google Ads, ...) without coding. Your data is automatically synced, allowing you to build cross sources reports & design impactful dashboards.

    Cost / License

    • Free
    • Proprietary

    Since

    • Since 2021

    Platforms

    • Software as a Service (SaaS)
    Whaly screenshot 1
    Whaly screenshot 1
    Whaly screenshot 2
    Whaly screenshot 3
    7 alternatives
  9. Aveloy Graph icon
     2 likes

    Aveloy Graph is an application for graph creation / data visualization - fast, easy to use and interactive.

    Cost / License

    • Free
    • Proprietary

    Since

    • Since 2016

    Platforms

    • Windows
    Aveloy Graph screenshot 1
    Aveloy Graph screenshot 1
    35 alternatives
  10. A global leader in business intelligence technology, MicroStrategy provides integrated reporting, analysis, and monitoring software that enables companies to analyze the data stored across their enterprise to make better business decisions.

    Cost / License

    • Paid
    • Proprietary

    Since

    • Since 2013

    Platforms

    • Online
    88 alternatives
  11. HappyMetrix lets you create beautiful dashboards, collecting validated data from diverse sources.Cut through the clutter, interpret the numbers and get things done.

    Cost / License

    • Paid
    • Proprietary

    Since

    • Since 2014

    Platforms

    • Windows
    • Mac
    • iPad
    • Android Tablet
    • BE flagBelgium
    • European Union flagEU
    Create beautiful dashboards
    Share you dashboards in real-time.
    Have access to your dashboards everywhere you go.
    +4
    Monitor your business' performance on a big screen.
    34 alternatives
  12.  2 likes

    JPivot is a JSP custom tag library that renders an OLAP table and let users perform typical OLAP navigations like slice and dice, drill down and roll up. It uses Mondrian as its OLAP Server. JPivot also supports XMLA datasource access.

    Cost / License

    • Free
    • Open Source

    Since

    • Since 2014

    Platforms

    • Windows
    • Mac
    • Linux
    Axis showing the parents of the members
    Axis in hierarchical mode
    Axis in Level Mode
This is useful, when the result ist sorted in break hierarchy mode.
    +8
    Sort options
  13. ApexCharts icon
     1 like

    ApexCharts.js - An open-source HTML5 JavaScript charting library that helps developers to create responsive & interactive JS charts for web pages.

    Cost / License

    • Free
    • Open Source

    Since

    • Since 2018 (updated Nov 2026)

    GitHub

    • GitHub stars: 15.2k

    Platforms

    • Online
    • IN flagIndia
    ApexCharts screenshot 1
    ApexCharts screenshot 1
    19 alternatives
  14. Tablefront icon
     1 like

    Tablefront is a premium, zero-configuration React DataTable with table, grid, and masonry layouts. Built on TanStack Table with TypeScript and composable UI.

    Cost / License

    • Pay once
    • Proprietary

    Since

    • Since 2025

    Platforms

    • Self-Hosted
    • React
    • NL flagNetherlands
    • European Union flagEU
    Fully customizable layouts
    Zero-config grid layout
    Masonry layout
    Advanced search and filtering out-of-the-box
    11 alternatives
  15. Dxyfer icon
     Like

    Dxyfer is a cloud-based ‘Augmented Intelligence’ platform offered as Software as a Service (SAAS), revolutionizing business Intelligence and data analysis by leveraging sophisticated purpose-built machine learning algorithms and language learning models.

    Cost / License

    • Free Personal
    • Proprietary

    Since

    • Since 2024

    Platforms

    • Google Sheets
    • Microsoft Excel
    • Google Drive
    • PostgreSQL
    • Microsoft SQL Server
    • MariaDB
    Dxyfer Dashboard
    AskData
    AutoDash
  16. Looker icon
     1 like

    Looker gives you access to your organization’s data. Many users start by browsing through the reports - which we call “Looks” - and dashboards that others in their organization have already created. This page will show you how to get started browsing.

    Cost / License

    • Pay once or Subscription
    • Proprietary

    Since

    • Since 2017

    Platforms

    • Online
    • US flagUnited States
    Looker screenshot 1
    150 alternatives
  17. Tanaza icon
     4 likes

    Tanaza, an Italian company, developed an intuitive and responsive cloud-based management software for IT professionals to operate Wi-Fi networks. At the core of Tanaza's technology is TanazaOS, a powerful Linux-based Operating System compatible with multiple wireless access...

    Cost / License

    • Subscription
    • Proprietary

    Application type

    Since

    • Since 2015

    Platforms

    • Software as a Service (SaaS)
    • IT flagItaly
    • European Union flagEU
    Tanaza screenshot 1
    Tanaza screenshot 1
    Tanaza screenshot 2
    31 alternatives
  18. ChartURL icon
     11 likes

    An Alternative to Google Image Charts that enables developers and marketers to embed personalized charts in their emails, Slackbots, web/mobile apps, and more.

    Cost / License

    • Freemium
    • Proprietary

    Since

    • Since 2016

    Platforms

    • Online
    • Self-Hosted
    65 alternatives
  19. Grid studio icon
     1 like

    Grid studio is a web-based spreadsheet application with full Python integration for advanced scripting and plotting capabilities.

    Cost / License

    Since

    • Since 2019 (archived)

    GitHub

    • GitHub stars: 8.8k

    Platforms

    • Self-Hosted
    Python scripting built in
    Add content to spreadsheet on-the-fly with Python
    Python web scraping
    Live plotting with matplotlib
    1 alternative
  20. Graphia icon
     1 like

    Graphia is a powerful open source visual analytics application developed to aid the interpretation of large and complex datasets.

    Cost / License

    Since

    • Since 2023 (updated Nov 2026)

    GitHub

    • GitHub stars: 279

    Platforms

    • Windows
    • Mac
    • Linux
    Graphia screenshot 1
    Graphia screenshot 1
    Graphia screenshot 2
    8 alternatives
  21. Streamhub icon
     1 like

    Streamhub is the universal OTT Analytics & DMP platform to manage video audience data across web, mobile and connected TV.

    Cost / License

    • Subscription
    • Proprietary

    Since

    • Since 2020

    Platforms

    • Online
    • Software as a Service (SaaS)
    • Android
    • iPhone
    • iPad
    • Playstation
    • Xbox
    • Apple TV
    • Fire TV
    • Roku
    • Chromecast
    Streamhub screenshot 1
    12 alternatives
  22. Search, filter and map locations by travel time rather than distance with this API. When added to a location search engine it can search and display results by time and create travel time maps for users. In-depth data analysis also available.

    Cost / License

    • Paid
    • Proprietary

    Since

    • Since 2016

    Platforms

    • Windows
    • Mac
    • Linux
    • Chrome OS
    • Online
    • iPhone
    • iPad
    • Apple TV
    • GB flagUnited Kingdom
    Mapping travel time areas in London
    28 alternatives
  23. ANDRE icon
     1 like

    ANDRE is a survey data analysis automation product. It takes tabular data and returns compelling analysis reports with data visualizations and synthesis slides. It makes the analysis process seamless by focusing on the narratives rather than the numbers.

    Cost / License

    • Freemium (Subscription)
    • Proprietary

    Since

    • Since 2024

    Platforms

    • Online
    • CH flagSwitzerland
    ANDRE Step 1: Context & Objectives
    ANDRE Step 2 : Generated Data Stories
    ANDRE Step 3: Analysis
    ANDRE Step 4: Conclusions