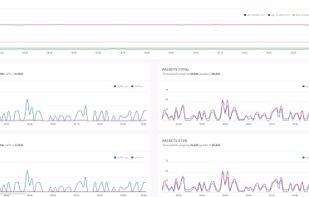

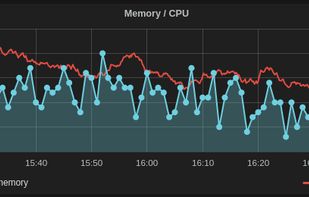
Grafana provides a powerful and elegant way to create, explore, and share dashboards and data with your team and the world.
 Sweden
 EU



+1





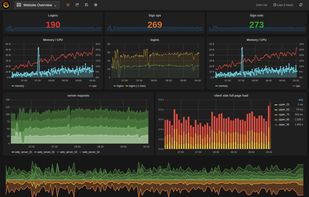
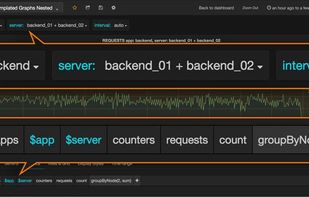
Grafana provides a powerful and elegant way to create, explore, and share dashboards and data with your team and the world.
SwedenEU
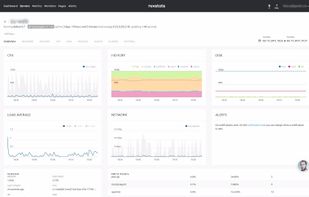
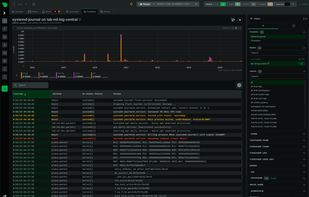
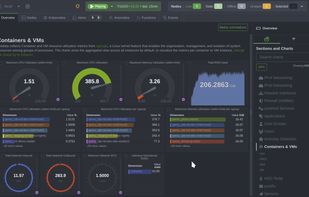
Netdata collects metrics per second and presents them in beautiful low-latency dashboards. It is designed to run on all of your physical and virtual servers, cloud deployments, Kubernetes clusters, and edge/IoT devices, to monitor your systems, containers, and applications.
 United States


Monitor and visualize your IT and DevOps environments seamlessly with over 120 integrations, enabling real-time insight across on-premise and cloud deployments. Utilize robust analytics, graphing, and correlation tools for error logging and network monitoring. Improve collaboration and proactive IT management.
United States
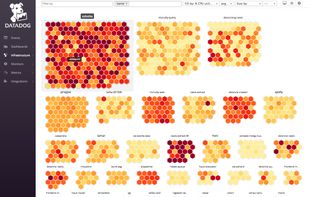
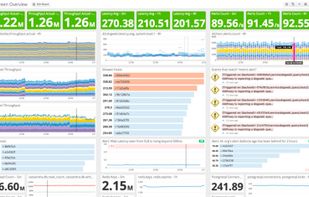
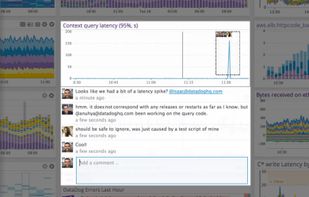


Open-source interface for real-time visualization, search, monitoring logs or metrics, anomaly detection, and natural language queries in Elasticsearch, supporting machine learning, automated alerting, threat detection, and integration with tools like Slack and ServiceNow.
 NetherlandsEU
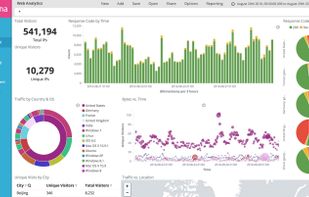
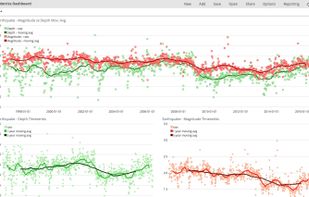
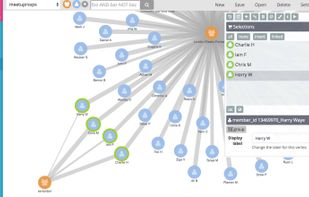
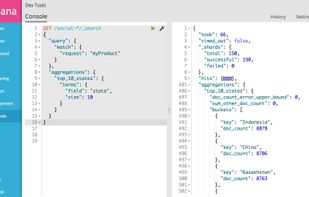


Tableau helps the world’s largest organizations unleash the power of their most valuable assets: their data and their people.
United States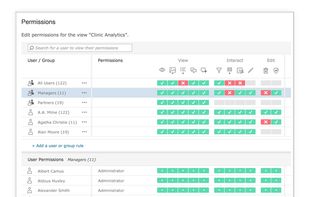
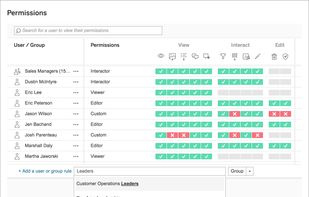
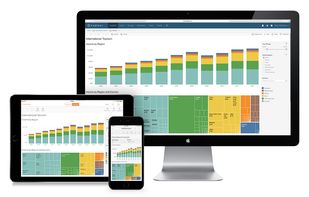
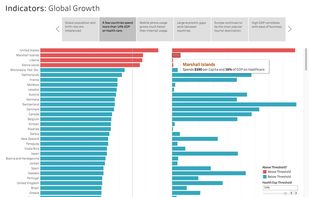


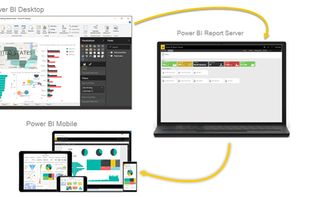
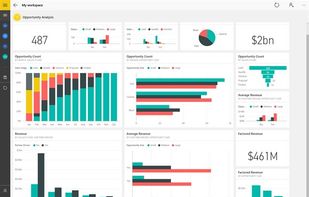
Utilize Microsoft's Power BI to convert varied data sources into interactive visual insights. It includes Power BI Desktop, online services, and mobile apps, allowing the creation, sharing, and consumption of business insights on any device, tailored to diverse business needs.
United States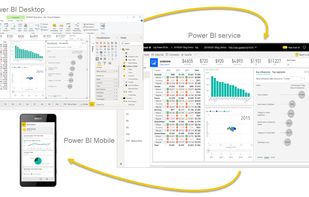



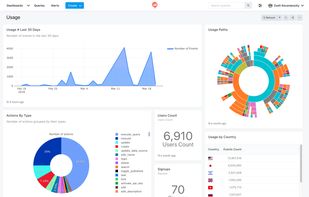
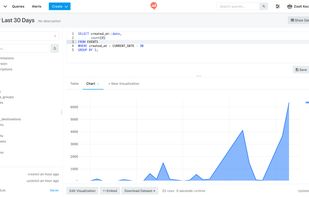
Redash helps you make sense of your data. Connect and query your data sources, build dashboards to visualize data and share them with your company.
United States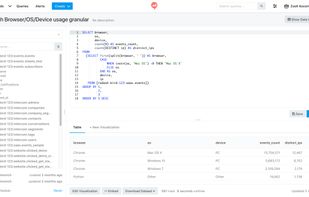


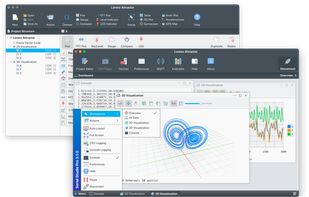
Serial Studio is an open-source, cross-platform telemetry dashboard and real-time data visualization tool. It supports input from serial ports, Bluetooth Low Energy (BLE), and TCP/UDP sockets. It's ideal for embedded devices, external tools, and network services.
 Mexico



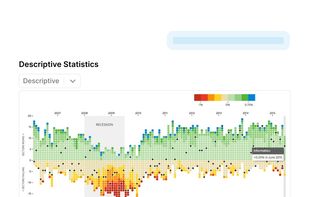
DataMotto empowers anyone to have a proactive AI data analyst. Your AI proactively analyzes your data sources, turns them into valuable insights, and guides you in taking informed decisions.




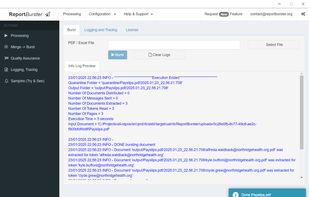
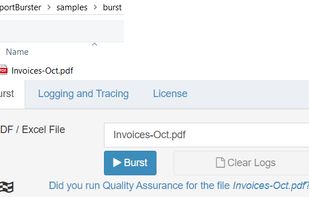
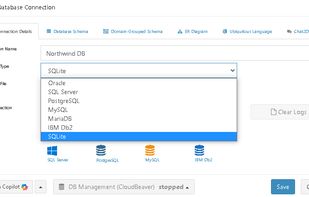
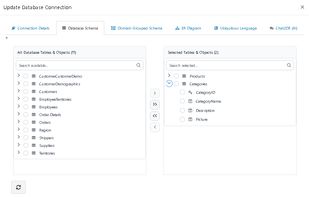
Report generation + report bursting + self-service portal + embeddable analytics. All in one platform. Self-hosted.


SaaS monitoring tool for linux servers and websites. Think up-time robot but with more features. You can monitor your linux hosts, windows hosts under development.
NetherlandsEU