


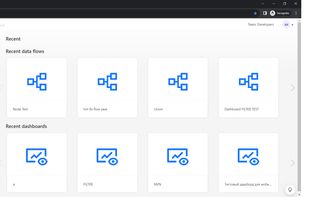
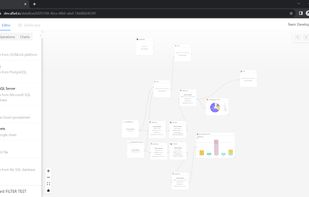
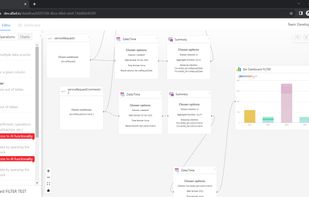
Business Intelligence (BI) analytics platform to build up graphical dashboard with charts, based on the data, gathered from different sources.
 United Kingdom



+2
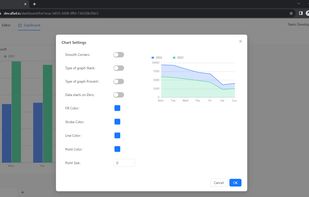


Business Intelligence (BI) analytics platform to build up graphical dashboard with charts, based on the data, gathered from different sources.
United Kingdom
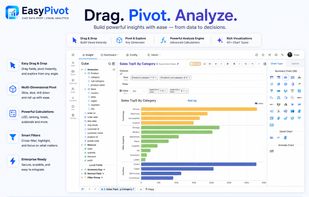
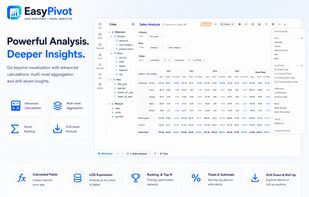
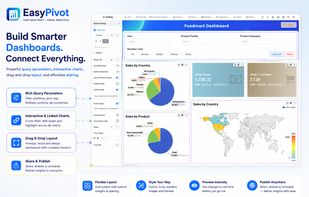
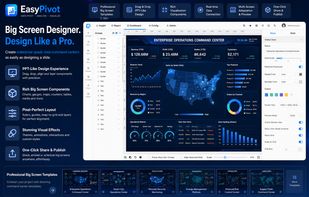
EasyPivot makes data analysis simple with a powerful, intuitive pivot engine. Easily slice, dice, filter, group, and visualize your data, build interactive dashboards, and turn raw data into actionable insights.
 United States


Chartbrew allows you to connect all your databases and APIs to create beautiful live charts and visualize your data. Chartbrew is built on open-source software featuring a chart builder, editable dashboards, embeddable charts, query & requests editor, and team capabilities.



Edalitics is an open-source business intelligence platform that lets you build interactive dashboards, analyze data from multiple sources, and connect AI assistants to your business data in minutes.
 Spain
 EU
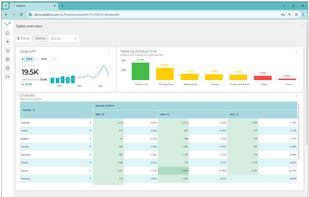


Full fledge AI (MCP, API, Agents) Analytics (Sheets on data lake) and Business Intelligence Platform (Charts, dashboards and reports).


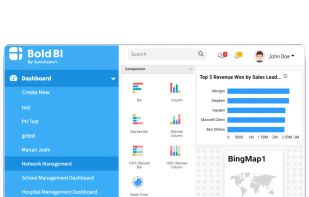
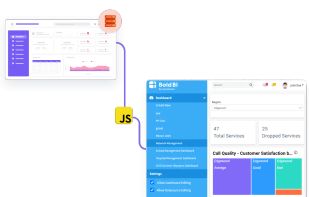
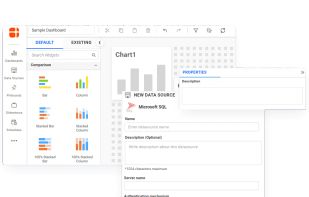
Bold BI is a comprehensive embedded analytics platform designed to empower end users with data-driven decision-making capabilities. Our solution is tailored for a variety of use cases, enabling you to integrate powerful analytics directly into your business applications.
United States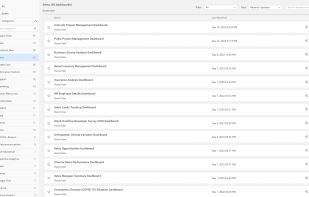


 Sweden


