The Géoclip interactive mapping solution is proposed by EMC3. Géoclip permits to publish online thematic atlas or territorial observatories. Géoclip allows you to build web mapping applications for cartographic representations of statistical data.
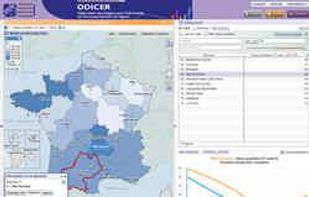

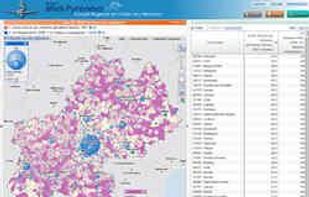
The Géoclip interactive mapping solution is proposed by EMC3. Géoclip permits to publish online thematic atlas or territorial observatories. Géoclip allows you to build web mapping applications for cartographic representations of statistical data.


Enterprise-caliber BI delivers accurate, actionable content in an intuitive, self-service environment. It allows users to combine data from different source systems to get answers to their most pressing business concerns in real time.


GNU datamash is command-line program which performs simple calculation (e.g. count, sum, min, max, mean, stdev, string coalescing) on input files. Datamash has a rich set of statistical functions, to quickly assess information in textual input files.
Create powerful dashboards from your company’s data and quickly discover insights with Chartio.


GGobi is an open source visualization program for exploring high-dimensional data. It provides highly dynamic and interactive graphics such as tours, as well as familiar graphics such as the scatterplot, barchart and parallel coordinates plots.

Formerly "periscope," Sisense for Data Teams is a cloud business intelligence tool with SQL, Python, and R support and visuals of the original Sisense platform.
During the ECU development process, measurement data that refers to different states of calibration data must be compared. The ETAS MDA (Measure Data Analyzer) measurement data analysis tool lets users visualize, further process, analyze, and document measurement data.
The Ptengine app helps marketers and webmasters turn more visits into conversions. By "conversions" we mean sales, leads, email subscribers, social shares - whatever goals people have for a website.

With accountanalysis you can evaluate Twitter accounts faster. Reasearchers and journalists use it determine how automated and fitting an accounts behaviour is, when it's active, which apps it uses and what URLs it shares.


One goal of Sympathy for Data is to enable users to handle data from many different sources and formats with ease. Connect to databases, select files from different network drives or automatically perform analysis on thousands of Excel-files on your local drive.
Premonition, helps organizations with lots of litigation find the best lawyers for specific cases. For Premonition CEO Toby Unwin, designing the Premonition big data system was very personal. “I had to deal with large amounts of litigation and realized I had no way to find out...
The caret package (short for _C_lassification _A_nd _RE_gression _T_raining) is a set of functions that attempt to streamline the process for creating predictive models. data splitting pre-processing feature selection model tuning using resampling.
Lumalytics lets you create dashboards with charts, data tables and filters that display data from your own data sources (MySQL, Postgres, Redshift, SQL Server or CSV files).


4th generation automation tool covering all aspects and phases of a DWH. Design & Development Lifecycle Management Operations Industry standards processes enable your agile Data Warehouse to delivery business value immediatelly.


CloudNine empowers legal and business professionals with eDiscovery automation software and professional services that simplify litigation, investigations, and audits for law firms and corporations.
Analyze runs and rides with device imports, training-load trends, recovery data, records, race estimates, and flexible training plans.


Deep.BI helps media publishers measure content performance and distribution across platforms. Deep.BI provides real-time data platform that helps editors and content creators grow their audiences with the highest level of engagement.

KnowledgeSEEKER is a data mining and predictive analytics software tool helping data analysts and business users with data exploration, development and deployment of predictive models.


Spend 90% less on your next Business Intelligence project with Pentaho Reporting, Analysis, Dashboards
365 Data Science is an online educational platform focusing on creating specialized data science content.
Grow is a cloud BI app that allows businesses to centralize data, build metrics, create dashboards, and track their success in real-time.