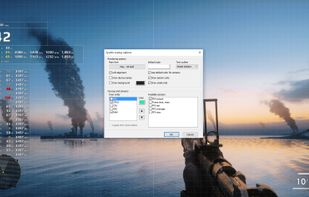
This tool is used for modifying game profiles inside the internal driver database of the nvidia driver. All game profiles are provided by the nvidia driver, but you can add your own profiles for games missing in the driver database.
 Germany
 EU


The best System Information alternative to MSI Afterburner is Open Hardware Monitor, which is both free and Open Source. If that doesn't suit you, our users have ranked more than 50 alternatives to MSI Afterburner and many of them are System Information Utilities so hopefully you can find a suitable replacement. Other interesting System Information Utility alternatives to MSI Afterburner are MangoHUD, LACT, iStat Menus and Rivatuner Statistics Server (RTSS).
This tool is used for modifying game profiles inside the internal driver database of the nvidia driver. All game profiles are provided by the nvidia driver, but you can add your own profiles for games missing in the driver database.
GermanyEU
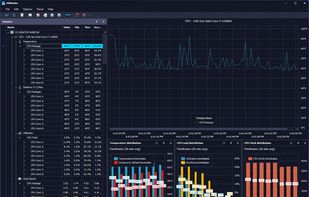
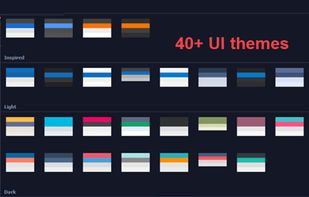
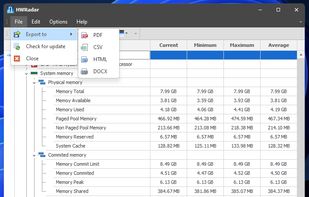
Delivers real-time insights on CPU, GPU, and memory performance using a customizable interface with over 40 themes, docking panels, and various export formats including PNG, PDF, CSV, DOC, and HTML. Features diverse CPU charts and visualization options for detailed analysis.
 United States


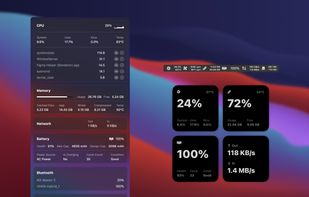
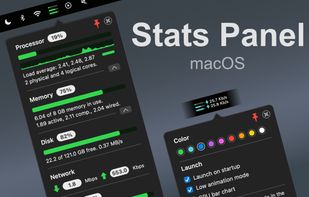
macOS menu bar utility written in SwiftUI that presents CPU, memory, disk, and network usage, plus Bluetooth battery levels, customizable Big Sur widgets, Dark Mode, and real-time sensor data. Open-source, lightweight, and compatible with Apple Silicon.
 China


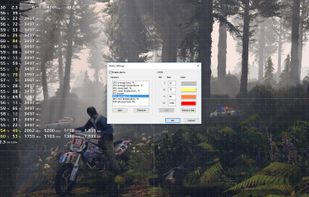
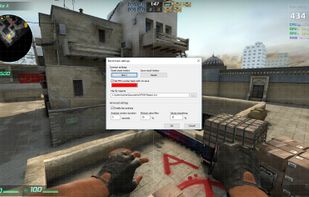
FPS Monitor tracks your PC's hardware state and displays this information as an overlay in-game.


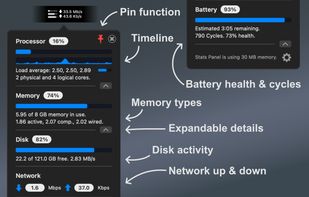
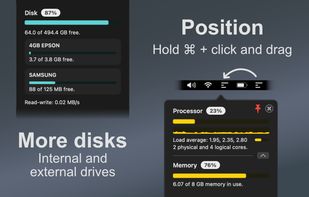
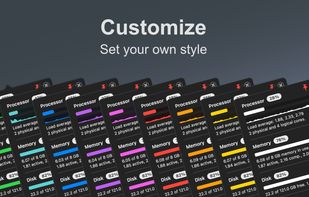
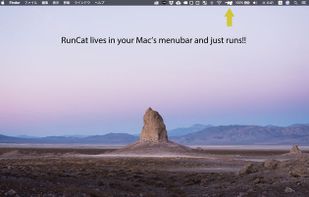
Lightweight macOS menu bar utility providing live CPU, memory, disk, network, battery, and thermal state monitoring, supporting Apple Silicon and Intel hardware, with customizable interface options, low resource usage, and strong privacy protections.
 United Kingdom


 Japan
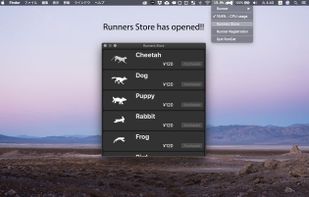
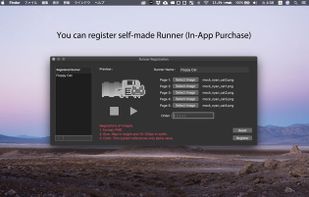
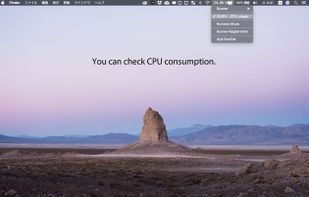


Xenon runs on your PC and puts live widgets on any screen you already have: the desktop itself, a second monitor, a small touchscreen, or an old tablet or phone that opens it in its browser over Wi-Fi, with nothing to install on that device.
 ItalyEU
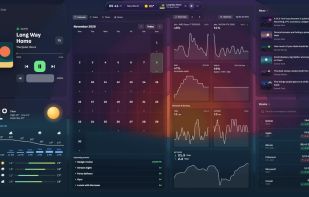
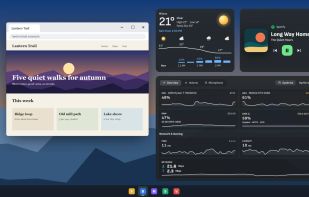
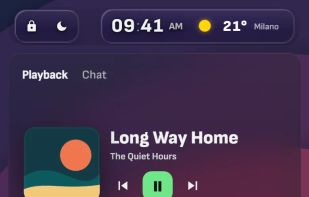
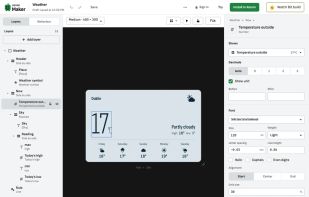


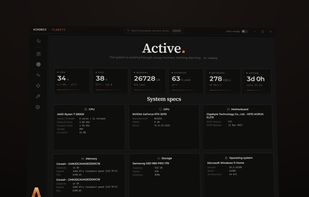
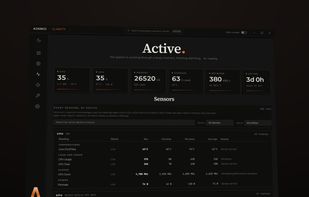
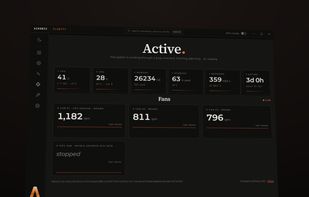
Monitors CPU, GPU, memory, storage, network and fan sensors in real time, showing why a reading is unavailable instead of supplying an estimate. Includes S.M.A.R.T. drive health, end-task controls, dead-pixel checks, plus an hour of in-memory history and JSON reports.
 Switzerland
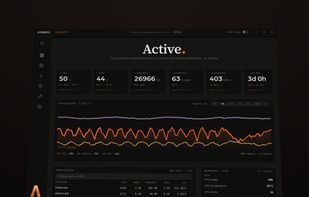

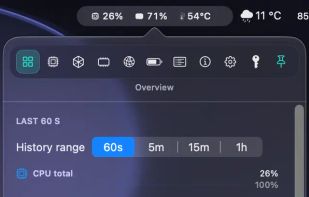
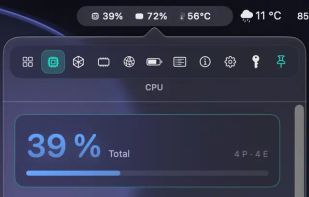
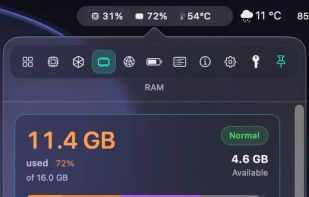
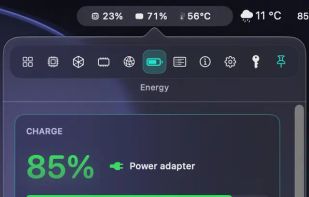
Live CPU, GPU, RAM, and thermal data directly in your macOS menu bar. Native for Apple Silicon, private by design, and built for fast first-glance insight.
GermanyEU