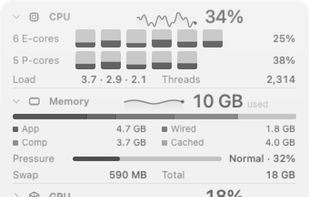
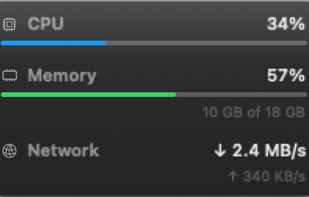
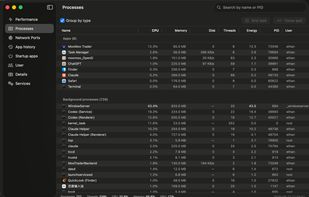
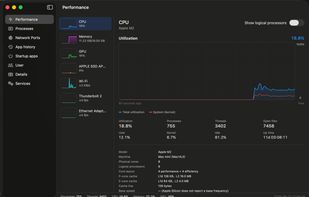
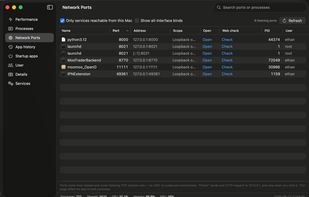
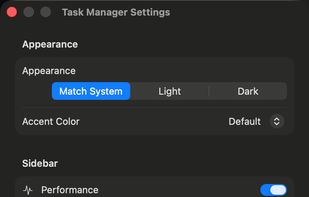
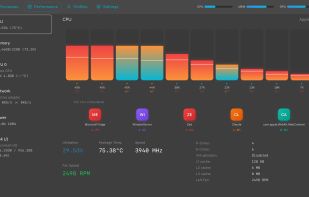
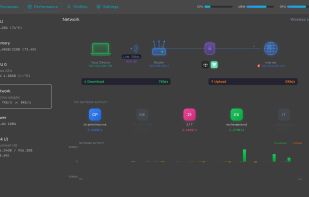
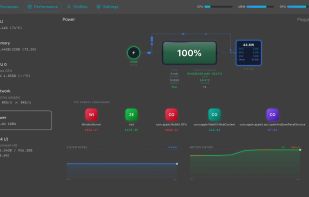
A Windows 11 Task Manager–style system monitor for macOS — processes, CPU/memory/GPU/disk/network, listening ports, startup items and services, with no password and no permission prompts.
Cost / License
- Free
- Open Source (MIT)
Platforms
- Mac



+2

T


MenuBar Stats has been discontinued. Similar apps include Open Hardware Monitor, which is free and open source. Other options are Stats, SpeedFan, Sidebar Diagnostics and iStat Menus. System Information Utilities like MenuBar Stats are a crowded field, with more than 25 alternatives for Mac, Windows, Linux and iPhone.
A Windows 11 Task Manager–style system monitor for macOS — processes, CPU/memory/GPU/disk/network, listening ports, startup items and services, with no password and no permission prompts.
RobuStats is a menu-bar system monitor for macOS. Watch CPU, GPU, memory, network, and battery health at a glance, with live charts one click away. RobuStats is included in every getapps.cafe subscription.
 United States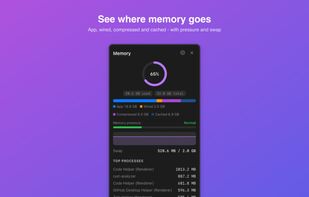
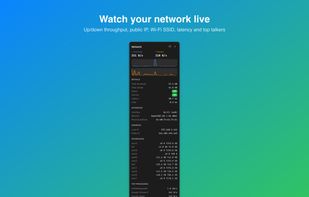
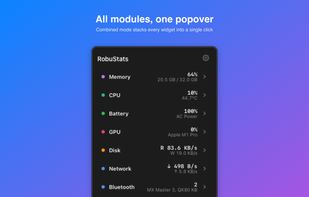
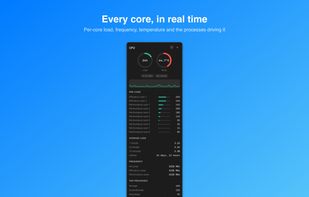

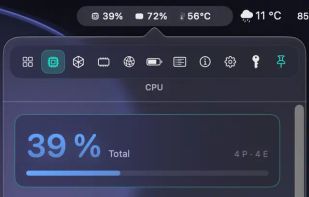
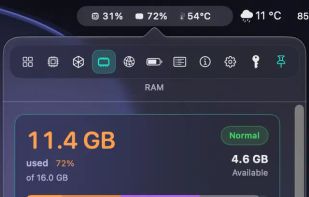
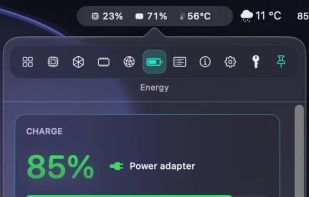
Live CPU, GPU, RAM, and thermal data directly in your macOS menu bar. Native for Apple Silicon, private by design, and built for fast first-glance insight.
 Germany
 EU
EU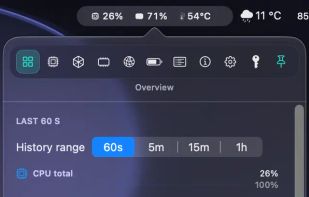


The best Windows Task Manager, macOS Activity Monitor, and Linux System Monitor alternative. A modern, cross-platform process manager to monitor CPU, memory, GPU, and more in real-time.
 United Kingdom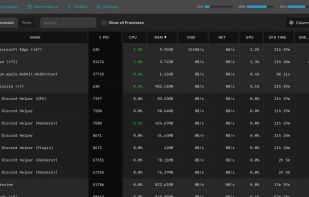


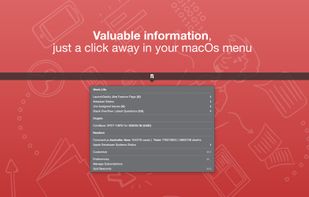
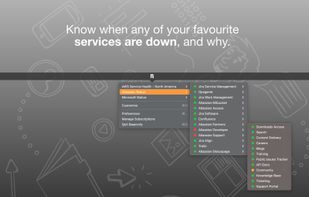
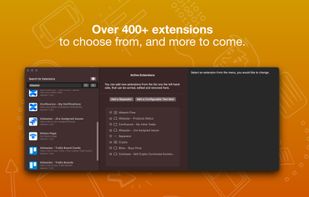
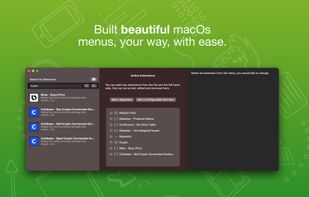
Beaconly is a flexible, easy to use data aggregating menu app that ties relevant information to you, beautifully one click-away in your macOs menu bar. Easily discover status of AWS, your Jira Tickets, and so much more.

A tiny native macOS menu-bar line for CPU, GPU, RAM, network activity, and the apps behind meaningful spikes.
 Australia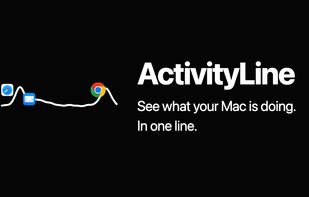

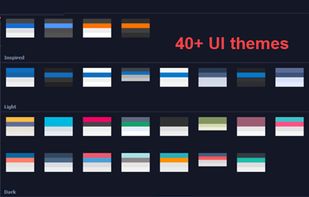
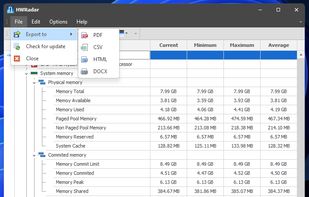
Delivers real-time insights on CPU, GPU, and memory performance using a customizable interface with over 40 themes, docking panels, and various export formats including PNG, PDF, CSV, DOC, and HTML. Features diverse CPU charts and visualization options for detailed analysis.
United States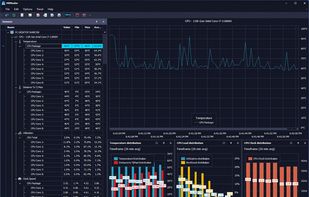


Your iPad and iPhone show you when apps are using your network. So why can't your Mac? Sure, there's always the Network section in Activity Monitor, but that's far from ideal. At best you can group by All Processes, Hierarchically, sort by Rcvd Bytes, and check the...



AirStats displays system readings in the menu bar, a drop-down panel, and a desktop widget. It provides sixteen menu bar metrics plus per-core CPU load, memory pressure and top users, GPU, network, disk, battery and connected-device levels, temperature, top processes, uptime...