Interactive environment for numerical computation, data analysis, algorithm development, matrix operations, data visualization, and toolboxes for specialized mathematical functions.
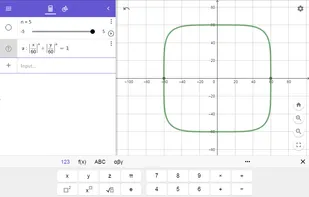
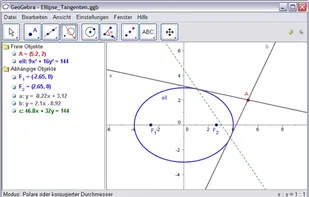
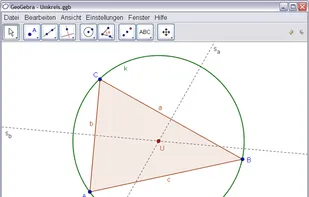
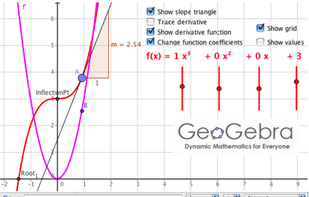
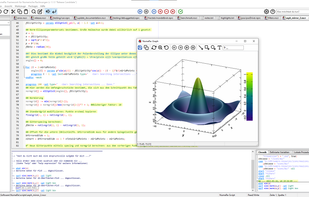
GeoGebra is free and multi-platform dynamic mathematics software for learning and teaching. It has received several educational software awards in Europe and the USA.
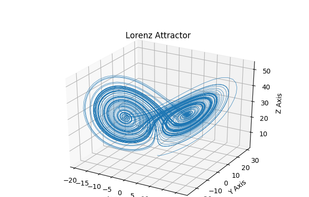
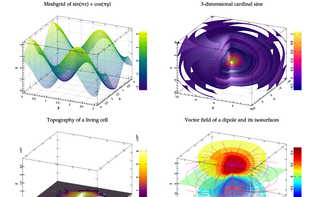
Julia is a high-level, high-performance dynamic programming language for technical computing, with syntax that is familiar to users of other technical computing environments. It provides a sophisticated compiler, distributed parallel execution, numerical accuracy, and an...
Matplotlib is a comprehensive library for creating static, animated, and interactive visualizations in Python. Matplotlib makes easy things easy and hard things possible.
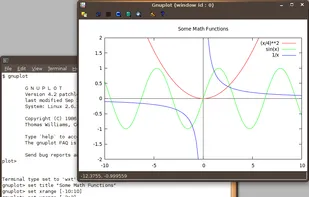
Gnuplot is a portable command-line driven interactive data and function plotting utility. It was originally intended as to allow scientists and students to visualize mathematical functions and data. It does this job pretty well, but has grown to support many non-interactive...
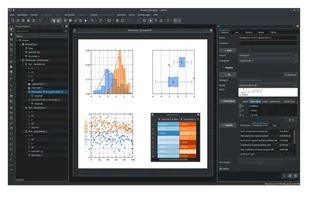
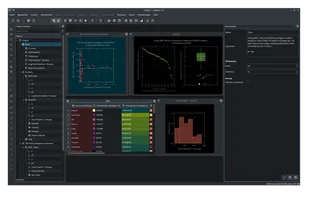
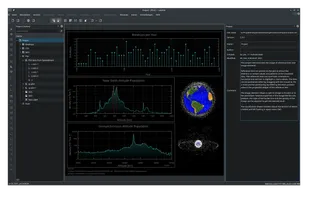
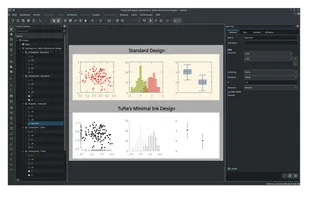
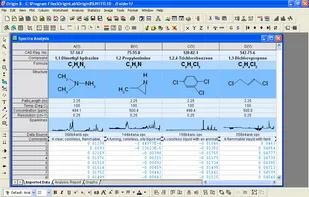
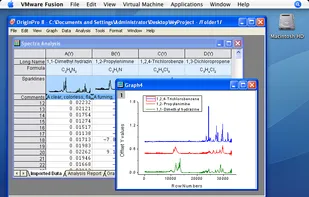
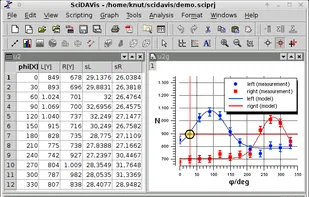
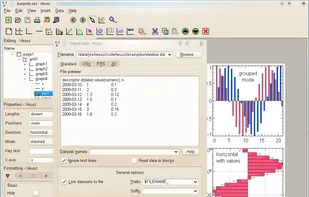
Data analysis and graphing software for scientists and engineers. It provides You with dozens of functionalities and options. The plotting engine is very effective and the plots are of high quality. A lot of statistical functionalities make data analysis very easy even for those...
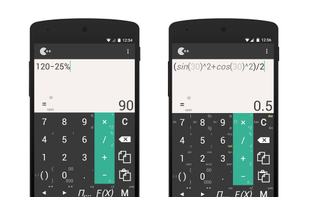
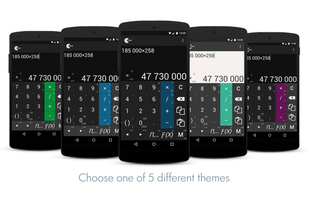
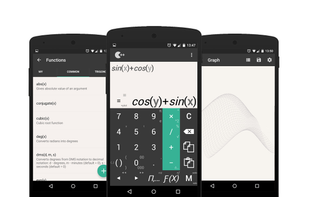
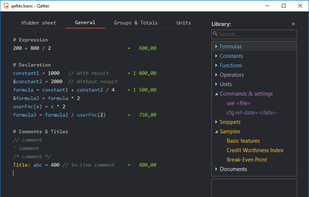
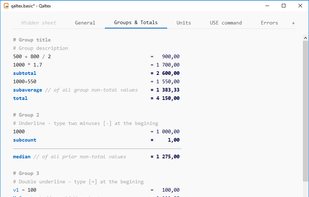
Qaltex is a tape-like calculator with straightforward interface and a lot of features. It is inspired by many other similar applications, but solves their disadvantages and at the same time it is empowered with some unique options and widgets.
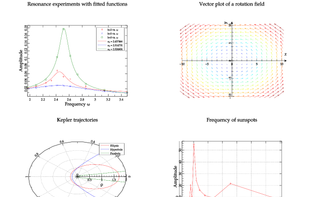
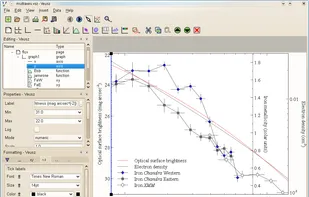
Open source numerical computation tool enabling advanced statistical analysis, nonlinear fitting, ODE solving, and 1D/2D data visualization for research.
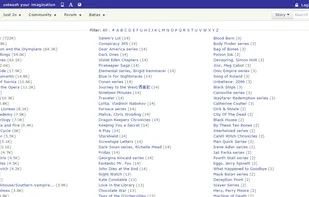
Automated archive supporting user-submitted stories in over 30 languages, with categories for genres and crossovers, reviews, profiles, and community forums.
ExcellentWriter is supposed to be a tool which lets you organize, write and format your novel inside Excel and in the end lets you use the power of Word to do the finishing touches.
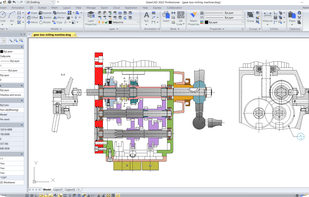
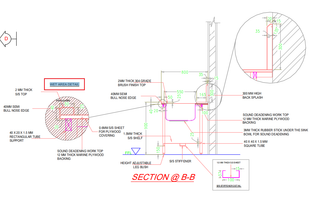
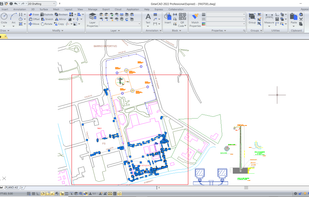
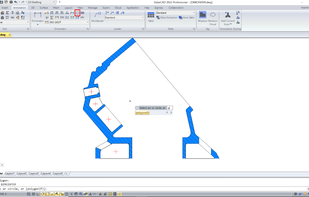
GstarCAD is well-known alternative CAD software of high compatibility with ACAD. With 27 years of continuous improvement and innovation, today GstarCAD is far ahead in performance, stability and becomes leading CAD software in the world.
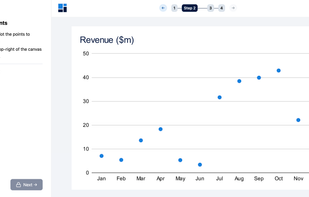
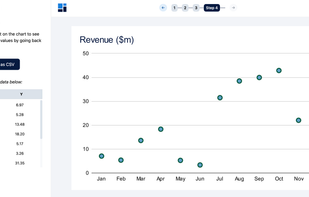
Datafromchart operates as a web-based application, offering users the capability to extract data directly from charts. Designed with analysts and researchers in mind, it facilitates the extraction of estimates from various sources such as industry reports or research papers.
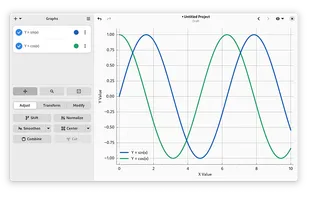
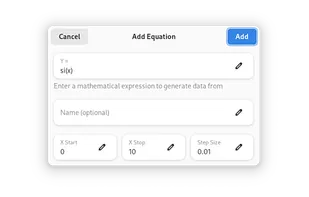
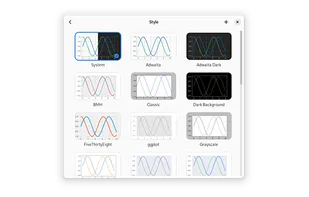
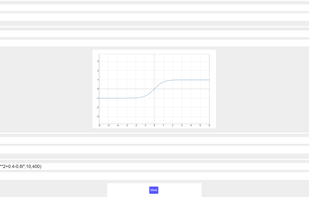
Graphs is a simple, yet powerful tool that allows you to plot and manipulate your data with ease. You can import data from two-column files or generate it via an equation. All data can be manipulated using a variety of operations such as the ability to select, cut, translate...
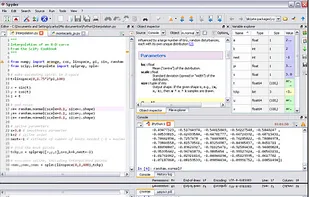
Python(x,y) is a free scientific and engineering development software for numerical computations, data analysis and data visualization based on Python programming language, Qt graphical user interfaces and .
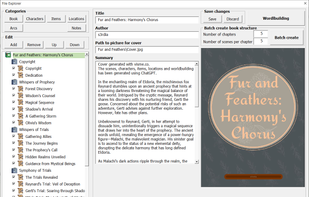
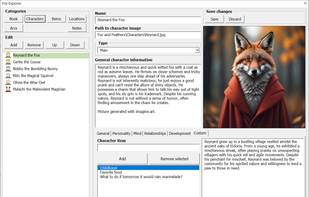
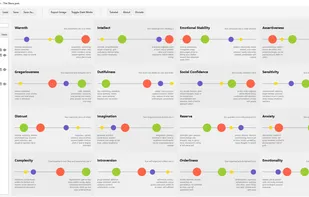
A free tool for storytellers to map their characters' personalities across 16 core traits, visualizing how they interact with the world and each other.
Serial Studio is an open-source, cross-platform telemetry dashboard and real-time data visualization tool. It supports input from serial ports, Bluetooth Low Energy (BLE), and TCP/UDP sockets. It's ideal for embedded devices, external tools, and network services.
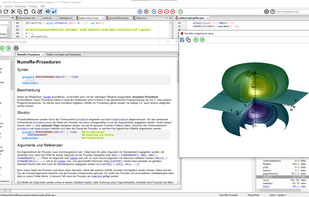
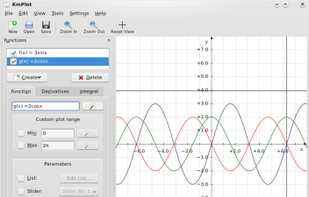
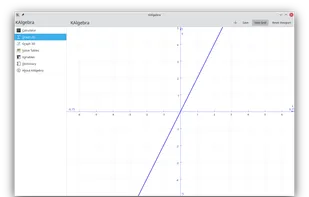
KAlgebra is a mathematical graph calculator included in the KDE education package. While it is based on the MathML content markup language, knowledge of MathML is not required for use. The calculator includes numerical, logical, symbolic, and analytical functions, and can plot...
 GNU Octaveand