Best alternatives are  Coronavirus COVID-19 Global Cases
6 alternativesCoronavirus COVID-19 Global CasesCoronavirus COVID-19 Global Cases
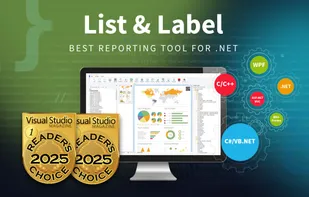
List & Label is a cross-platform reporting tool for software developers. The component extends software with reporting, output and analysis functions such as tables, charts, barcodes, lists, etc.
 JasperReports
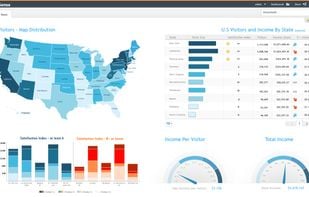
Sisense is a business intelligence and data analytics software that lets non-techies join, analyze, and visualize multiple large data sets in interactive dashboards.
 Openpanel.devand
 Tableau
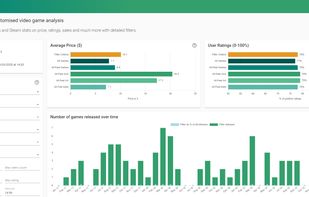
VG Insights offers free tools for market research, competitor benchmarking and industry trends analysis.
 Steam Database
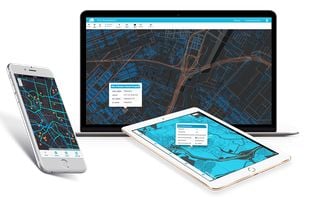
GIS Cloud is a complete Online Mapping Solution for:

Predixion Software was founded on the belief that predictive analytics has the power to create a smarter, safer and healthier world – and that access to that power should not be limited. To achieve this vision, Predixion developed Predixion Insight™, a predictive analytics...
 Altair RapidMiner
Rule-based analyses of similarity, influences or dependencies make hidden information visible. The comprehensive analysis results are depicted in interactive dashboards with organic or hierarchical graphs, in form of diagrams, tables or matrices.

Automated Information Retrieval, Automated Root Cause Analysis & Automated MRO Classification.
Altair RapidMinerand Actian
Teradata Corporation (NYSE: TDC) is a global leader in analytic data platforms, marketing and analytic applications, and consulting services, helps organizations become more competitive by increasing the value of their data and customer relationships.


 Tableauand
 Google Charts
Actian transforms Big Data into business value for any organization? Not just those with considerable resources. Actian provides transformational business value by delivering actionable insights into new sources of revenue, business opportunities, and ways of mitigating risk...
Altair RapidMinerand KNIME
KNIME
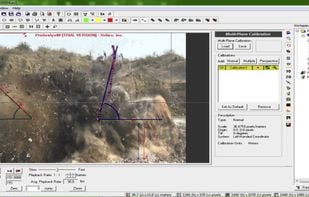
ProAnalyst is the software package for automatically measuring moving objects with video. ProAnalyst allows you to import virtually any video and quickly extract and quantify motion within that video. Used extensively by NASA, engineers, broadcasters, researchers and athletes...
 Kinoveaand
 SwingVision
Siren is an all-in-one investigation platform that safeguards people, assets, and networks by integrating data from open sources, vendors, and classified channels.

 Maltegoand
 PhoneInfoga
IBM InfoSphere BigInsights brings the power of Hadoop to the enterprise. Apache Hadoop is the open source software framework, used to reliably managing large volumes of structured and unstructured data.
 Google Cloud Dataproc
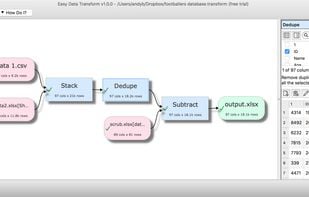
Data transformation software for Windows and Mac. Merge, dedupe, clean and reformat your data without programming.
 R (programming language)
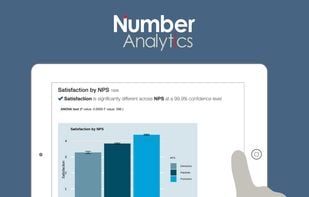
Number Analytics is an web based statistical software for academics and market research supporting various types of data (SPSS, Excel, CSV, STATA, Minitab, SAS) and platforms (iOS, Android, and Web).
 R (programming language)
Analyze and Monitor SQL Database. Explore Data with Query Builder, Visualise Data, Build Custom Dashboard and get Alerts for Data changes via Slack and Email.

Collect, store, structure, and analyze all your data. More powerful than a spreadsheet, still as easy to use. Fully customizable, but works like magic out of the box.
 Proton Sheets
CRYPTOFINANCE is a Google Sheets add-on that provide the CRYPTOFINANCE() function. It connects to CoinMarketcap and 196 other exchanges to return cryptocurrencies prices, volume, marketcap and much more.
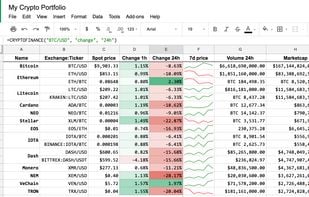
 CoinMarketCapand
 Coingecko
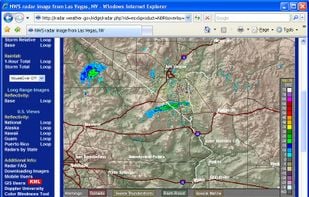
GetNexrad.exe is a tool used to view NOAA WSR-88D Nexrad doppler radar images and compute point and area average rainfall and to generate the basin point file used by GetRealtime.exe for automating computaion of a basin average rainfall time series in real time.
 wXand
wXand Supercell Wx
Technical graphing and data analysis for Macintosh and Windows. IGOR Pro creates publication quality scientific graphics used by scientists and engineers around the world. IGOR Pro 6 is an extraordinarily powerful and extensible scientific graphing, data analysis, image...
 MATLABand
 Matplotlib
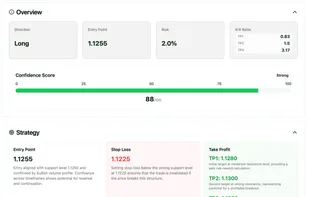
AI-powered trading platform delivering real-time, multi-timeframe market intelligence, precision trade signals, and risk-optimized strategies for forex, crypto, and stocks.
 TradeSantaand
 Pionex
Hazelcast is an in-memory Open Source data grid based on Java. By having multiple nodes form a cluster, data is evenly distributed among the nodes. This allows for horizontal scalability both in terms of available storage space and processing power.

Easily collect field data like images, videos, audios, and text using the Axonator data collection app for better speed, accuracy, and higher productivity.

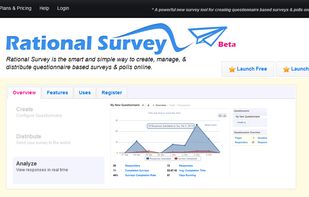
Easily create, distribute, and analyze questionnaire based surveys online. Unfortunately the very important features "Invite others to view survey results" (Share Analytics Pages) and (Response Charts & Graphs) are not supported by the free plan.
 Google Formsand
 LimeSurvey
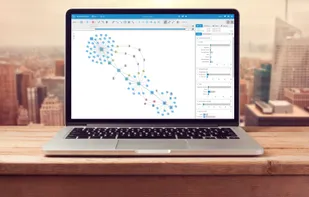
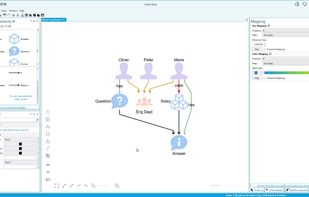
Graphlytic is a customizable BI web application for graph visualization and analysis of highly interconnected data. Users can interactively explore the graph, look for patterns and get deep insights, applicable for various use-cases, such as research.