
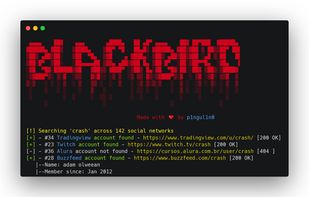
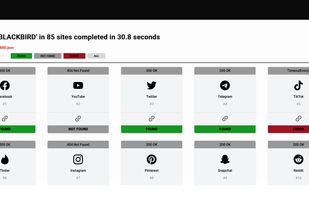
Performs username and email searches across 600+ platforms, integrates automated AI analysis, metadata extraction, WhatsMyName support, export options, and CLI.
Cost / License
- Free
- Open Source (GPL-3.0)
Platforms
- Mac
- Windows
- Linux
- Python
 Best alternatives are21 alternatives


Cost / License
- Free
- Proprietary
Application types
Platforms
- Windows
- Windows Mobile
- Android
- HUAWEI AppGallery


 +5
+5 Best alternatives are70 alternatives
 calibreand

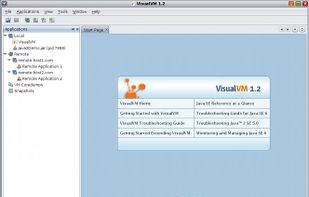
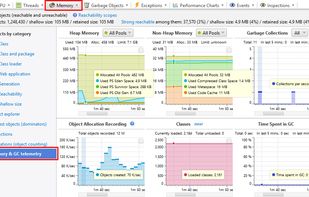
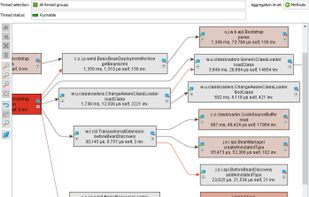
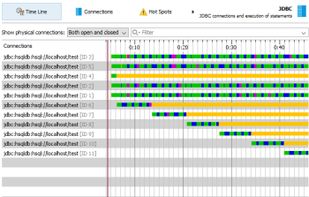
VisualVM is a visual tool integrating several commandline JDK tools and lightweight profiling capabilities. Designed for both production and development time use, it further enhances the capability of monitoring and performance analysis.
Cost / License
- Free
- Open Source
Platforms
- Mac
- Windows
- Linux
 Best alternatives are11 alternatives
 Apache NetBeansandJJConsole
Cost / License
- Freemium
- Proprietary
Platforms
- Mac
- Windows
- Linux
 +3
+3

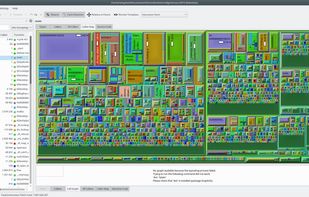
KCachegrind is a profile data visualization tool, used to determine the most time consuming parts in the execution of a program.
Cost / License
- Free
- Open Source (GPL-2.0)
Platforms
- Linux
- KDE Plasma
- Flathub

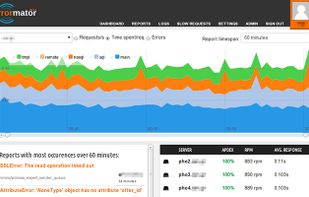
App Enlight- provides a helpful interface to let you and your team save time spent on debugging and reproducing errors and performance problems from a production environment.
Cost / License
- Freemium
- Proprietary
Alerts
- Discontinued
Platforms
- Mac
- Windows
- Linux
- Online
- Android
- iPhone
- Android Tablet

Percona Toolkit is a collection of advanced open source command-line tools, to perform a variety of MySQL®, MongoDB® and system tasks that are too difficult or complex to perform manually. Before being acquired by Percona it was know as Maatkit.
Cost / License
- Free
- Open Source
Platforms
- Linux
Best alternatives are8 alternatives
Cost / License
- Free
- Open Source
Platforms
- Windows
- Linux
- BSD
- Solaris
 +4
+4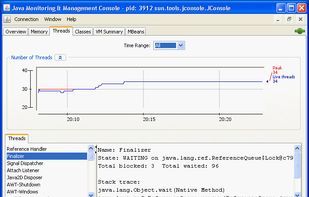 Best alternatives are8 alternativesApache NetBeansand

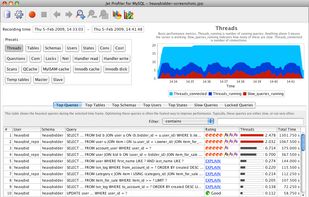
Query profiling tool for the MySQL database server, helps you spot performance bottlenecks, heavy sql queries and most accessed db tables.
Cost / License
- Freemium
- Proprietary
Platforms
- Mac
- Windows
- Linux
 Best alternatives are3 alternatives
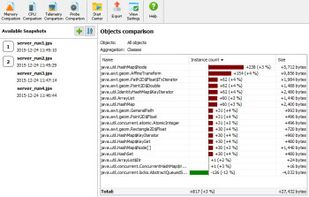
The Eclipse Memory Analyzer is a fast and feature-rich Java heap analyzer that helps you find memory leaks and reduce memory consumption. Use the Memory Analyzer to analyze productive heap dumps with hundreds of millions of objects.
Cost / License
- Free
- Open Source
Platforms
- Mac
- Windows
- Linux
Best alternatives are8 alternativesApache NetBeansand
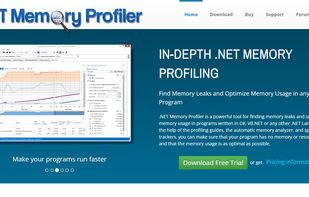
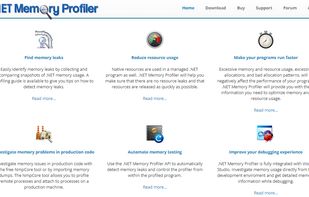
.NET Memory Profiler is a powerful tool for finding memory leaks and optimizing the memory usage in programs written in C#, VB.NET or any other .NET Language.
Cost / License
- Paid
- Proprietary
Platforms
- Windows

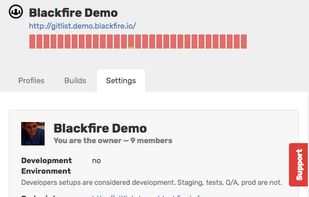
Profile any SE or EE application, server, technology and framework; on multiple platforms; locally and remotely; in development, testing and production. For teams and companies of any size.
Cost / License
- Paid
- Proprietary
Platforms
- Mac
- Windows
- Linux
 Best alternatives are9 alternativesApache NetBeansand
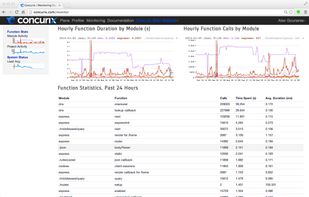
Concurix is a comprehensive profiling and monitoring service for Node.js. Pricing plans are simple and allow for unlimited profiling and monitoring on unlimited servers for a single, low price.
Cost / License
- Paid
- Proprietary
Platforms
- Online
- Chrome OS
- Node.JS

A development toolsuite for high performance software - it helps solve bugs and speed up applications that use multiple threads or processes.
Cost / License
- Paid
- Proprietary
Platforms
- Linux

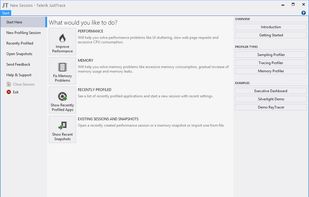
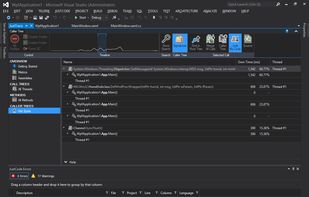
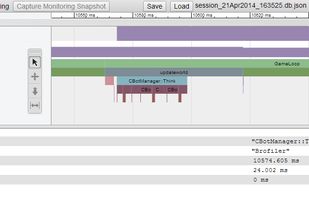
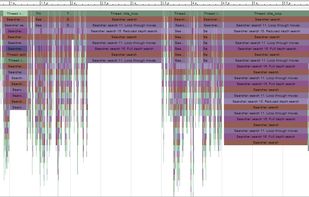
JustTrace is Telerik’s 2-in-1 memory and performance profiler for .NET. JustTrace profiles .NET apps to pinpoint and assist in resolving memory leaks and performance problems which may damage application quality.
Cost / License
- Paid
- Proprietary
Alerts
- Discontinued
Platforms
- Windows
 Best alternatives are10 alternatives
Cost / License
- Free
- Proprietary
Platforms
- Mac
- Windows
- Linux


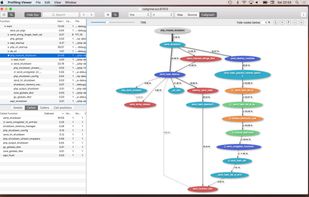
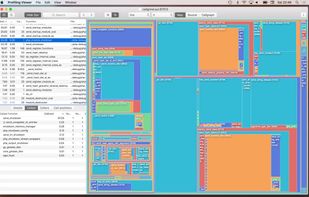
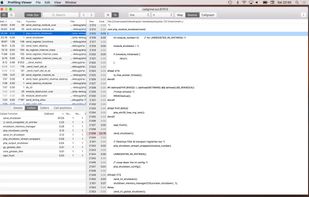
Profiling Viewer opens and visualizes callgrind files. You can use Treemap, Callgraph, flat or hierarchic lists to identify functions where your application spends more time than expected.
Cost / License
- Paid
- Proprietary
Platforms
- Mac
 +2
+2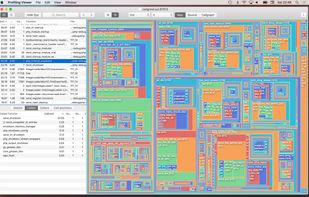 Best alternatives are4 alternatives
 KCacheGrindandWWebgrind
JProfiler's intuitive UI helps you resolve performance bottlenecks, pin down memory leaks and understand threading issues.
Cost / License
- Paid
- Proprietary
Platforms
- Mac
- Windows
- Linux
 Best alternatives are7 alternatives
Axeptio is the first user consent management platform compliant with the new General Regulations for the protection of personal data (RGPD/GDPR).
Cost / License
- Freemium
- Proprietary
Platforms
- Online


 +1
+1

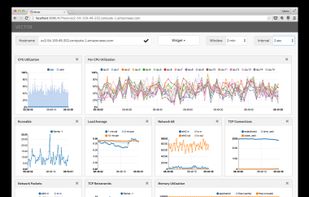
Vector is an open source on-host performance monitoring framework which exposes hand picked high resolution system and application metrics to every engineer’s browser. Having the right metrics available on-demand and at a high resolution is key to understand how a system behaves...
Cost / License
- Free
- Open Source
Platforms
- Linux
 Best alternatives are5 alternatives
 Prometheusand
- Best alternatives are9 alternatives


