VisualVM Alternatives
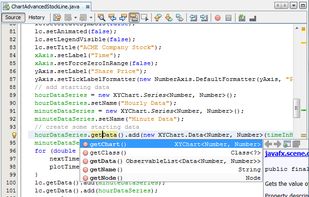
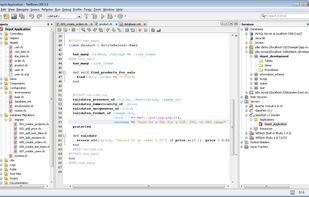
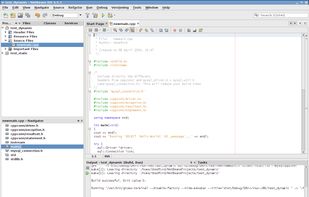
VisualVM is described as 'visual tool integrating several commandline JDK tools and lightweight profiling capabilities. Designed for both production and development time use, it further enhances the capability of monitoring and performance analysis' and is an app in the Development category. There are eight alternatives to VisualVM for Windows, Linux, Mac, BSD and Solaris. The best alternative is Apache NetBeans, which is both free and Open Source. Other great apps like VisualVM are Eclipse Memory Analyzer (Free, Open Source), YourKit Java Profiler (Paid), JConsole (Free, Open Source) and JProfiler (Paid).
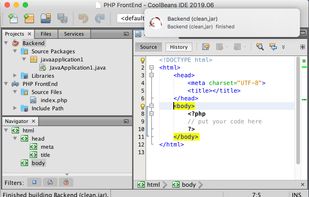
- Development Environment, Tooling Platform and Application Framework.
Discontinued
Python plugin for NetBeans (nbPython) has been discontinued since v8.1
- The Eclipse Memory Analyzer is a fast and feature-rich Java heap analyzer that helps you find memory leaks and reduce memory consumption. Use the Memory Analyzer to analyze productive heap dumps with hundreds of millions of objects.No screenshots yet
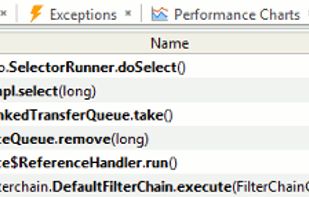
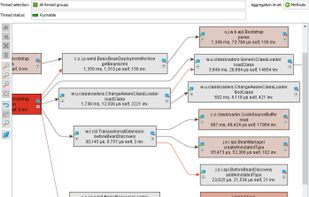
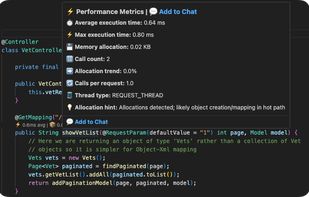
- Profile any SE or EE application, server, technology and framework; on multiple platforms; locally and remotely; in development, testing and production. For teams and companies of any size.
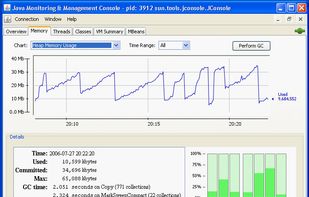
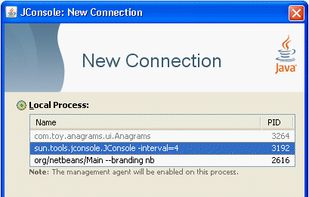
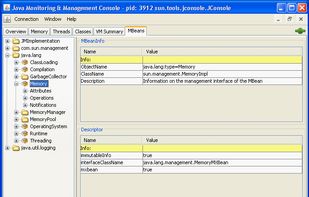
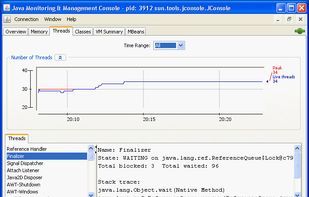
- The JConsole graphical user interface is a monitoring tool that complies to the Java Management Extensions (JMX) specification.
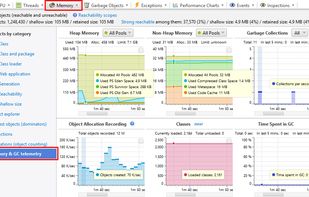
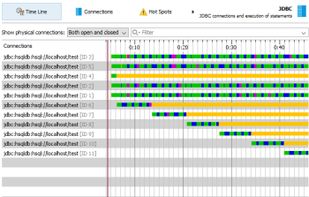
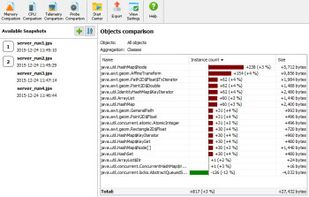
- JProfiler is the leading Java Profiler for profiling on the JVM. JProfiler's intuitive UI helps you resolve performance bottlenecks, pin down memory leaks and understand threading issues.
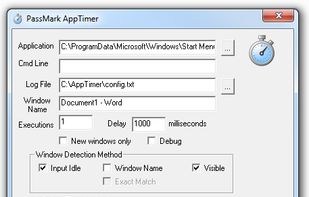
- AppTimer will run an executable a number of times and time how long it takes for the application to reach a state where user input is being accepted before exiting the application.
- YourKit Profiler provides zero-overhead profiling for your .NET applications and makes code profiling and memory usage optimization simple and fast.No screenshots yet
YourKit .NET Profiler vs VisualVM opinions
sipi This profiler is for .NET, not for Java