


Operational software for an AI-powered world - connecting systems, unifying data + enabling custom applications and AI on existing infrastructure.
 Australia


+4


Best alternatives are  Lovableand

47 alternativesLovableand

Operational software for an AI-powered world - connecting systems, unifying data + enabling custom applications and AI on existing infrastructure.
AustraliaLovableand
ATSD is purpose-built for analyzing and reporting on massive volumes of time-series data collected at high frequency. Features include data analytics, visualization, data forecasting, reporting, alerting. All in one product built for big data.


SIMON is a powerful, flexible, open-source and easy to use knowledge discovery application. SIMON implements machine learning (autoML) and statistical data discovery features that will help you to illustrate dynamic relationships and provide you with a structural sense of your...


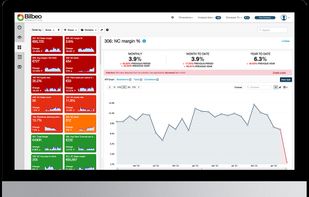
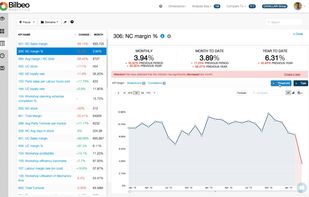
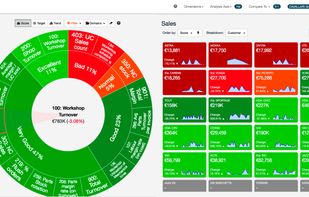
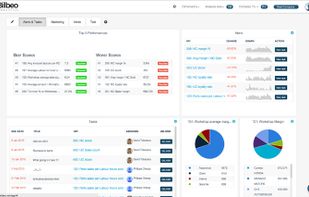
Bilbeo is a SaaS Business Intelligence tool that helps managers focus on critical KPIs and improve Business Performance using an intuitive Business Dashboard that detects and alerts on bad performance.
 United Kingdom


The Prognoz Platform is a next-generation BI platform for building high-tech business applications on a turnkey basis. It supports the development of software solutions on the desktop, Web, and mobile devices for visualization and online analytical processing (or OLAP)...


Filter, analyse and edit information in interactive point-and-click graphs, charts and maps, import web content, and create slider-driven models.

 OpenRefine

DLH.io is a data management platform for marketers, operations, and data engineering teams that removes data headaches. Our mission is to make data analysis simpler, more productive and more connected. It's not just ETL/ELT, it's AI enabled marketing and operations intelligence.


The Google Ngram Viewer is an online phrase-usage graphing tool originally developed by Jon Orwant and Will Brockman of Google, inspired by a prototype (called "Bookworm") created by Jean-Baptiste Michel and Erez Aiden from Harvard and Yuan Shen from MIT.


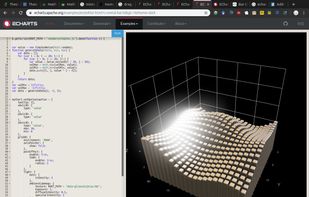
ECharts is an open-sourced JavaScript visualization tool, which can run fluently on PC and mobile devices. It is compatible with most modern Web Browsers, e.g., IE8/9/10/11, Chrome, Firefox, Safari and so on.

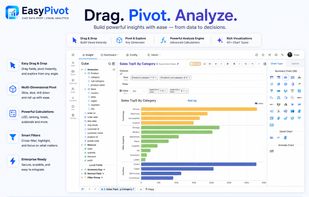
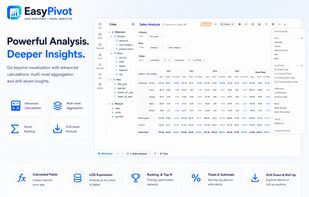
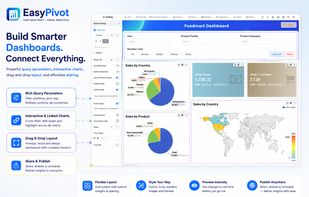
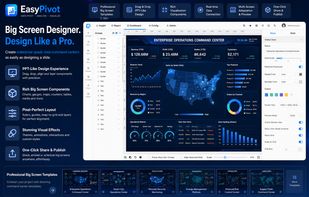
EasyPivot makes data analysis simple with a powerful, intuitive pivot engine. Easily slice, dice, filter, group, and visualize your data, build interactive dashboards, and turn raw data into actionable insights.
 United States

Generate visual sitemaps + screenshots for live & staging websites. Run Audits & Plan Content & Create Flows for SEO, UX, and Competitor Analysis.
United States


VisuaLeaf is a modern, fast MongoDB GUI tool featuring visual diff, an intuitive aggregation pipeline builder, and sync orchestration.


The Planet Thinks shows Wikipedia being edited in real time on a realistic 3D day/night globe. Every spark is a live edit to an article about a place, drawn where that place is on Earth, across ~300 language editions.


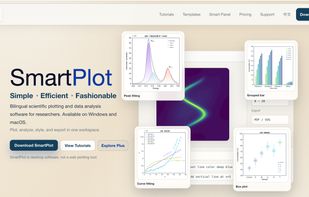
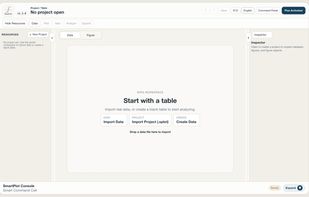
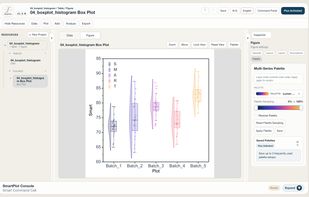
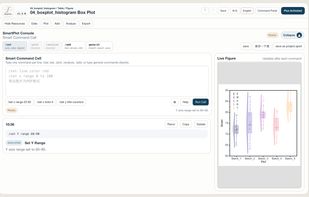
SmartPlot is a desktop scientific plotting and data analysis application designed for researchers who want a direct workflow from data tables to editable, publication-ready figures.
 Hong Kong

Steema Software - award winning Charting, Gauge and Map components for mobile application developers - TeeChart Mobile, Mobile Chart Library for Android
 Spain
 EU


There are more than 15 years of charting development investment in TeeChart for .NET's v2011 charting engine. The current Chart for .NET version offers a great generic Charting control for a myriad of charting requirements, targeting too, important vertical areas such as the...
SpainEU


Analance combines Data Science, Business Intelligence, and Data Management capabilities in one integrated, self-serve platform to provide a seamless experience.
 India
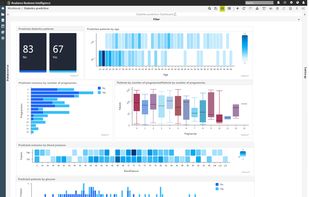
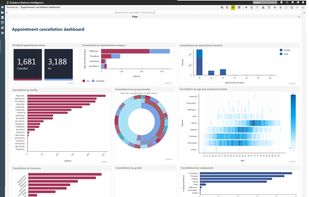
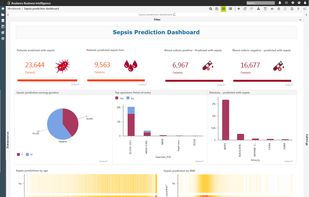


KPI Metrics - Quantum.io is a truly Collaborative Business Intelligence tool allowing real-time business agility. Connect to app, device or machine data. Quickly build your KPI Metrics dashboard and become instantly agile.
United Kingdom

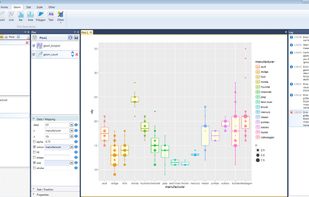
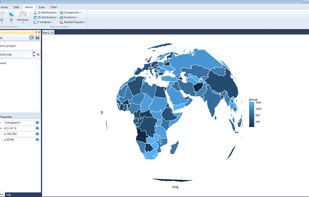
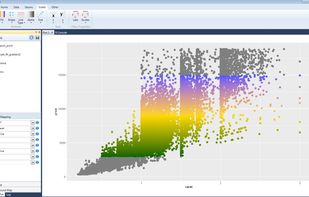
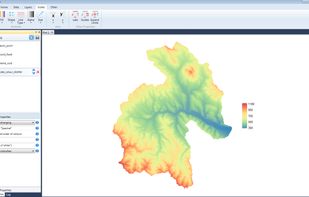
Stagraph is new professional tool for visual data exploration and statistical graphics. This tool brings data science features and functions of R language to user without the need of coding. Your workflow in software is as follows:
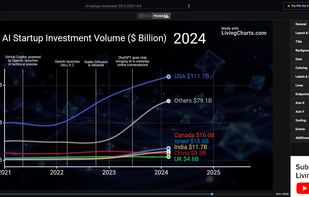
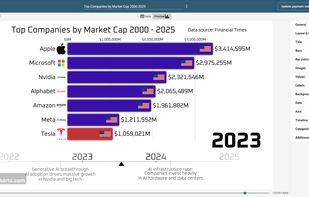
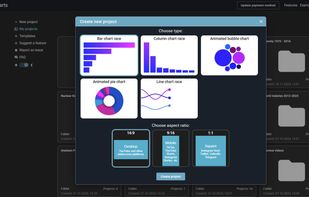
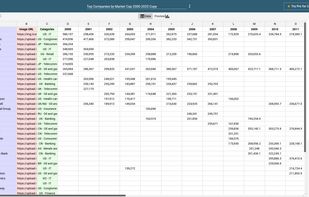
Create animated charts and bar chart race videos online. Import your data, customize visuals, and export high-quality videos in minutes.


For novice to expert market researchers, Q quickly turns survey data into smart insights, beautiful visualizations and clever reports, using the most advanced analysis techniques. Use menus or code to do the most advanced analyses; while smart systems and automated...
Australia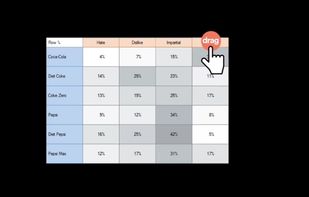
 R (programming language)

Reshape.XL in an Excel add-in for data processing. With this add-in you can clean, complete, reshape, wrangle, summarize, edit, subset, select, format, separate, unite, pivot, unpivot, combine your data that are messy, incomplete, contain many records and variables.


 OpenRefineand


VisIt is an Open Source, interactive, scalable, visualization, animation and analysis tool. From Unix, Windows or Mac workstations, users can interactively visualize and analyze data ranging in scale from small (<10^1 core) desktop-sized projects to large (>10^5 core)...

Manage aggregate data with a flexible data model which has been field-tested for more than 15 years. You can set up data elements data entry forms, validation rules, indicators and reports to create a fully-fledged system for data management.


 Russia




 Norway

