D3.js is a JavaScript library for manipulating documents based on data. D3 helps you bring data to life using HTML, SVG, and CSS.
Cost / License
- Free
- Open Source
Application type
Platforms
- Online
- Self-Hosted
 United States




+6


Sites and apps similar to ECharts include D3.js, which is free and open source. Other options are Chart.js, CanvasJS Charts, AnyChart and C3.js. In total there are five Charting Library Tools like ECharts for self-hosting, Android, iPhone, Mac and Windows.
D3.js is a JavaScript library for manipulating documents based on data. D3 helps you bring data to life using HTML, SVG, and CSS.
United States
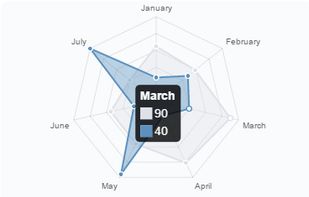
Easy, object oriented client side graphs for designers and developers. Open source HTML5 charts using the canvas tag. Chart.js is an easy way to include animated graphs on your website.


CanvasJS is an easy to use HTML5 and Javascript Charting library. It runs across devices including iPhone, iPad, Android, Windows Phone, Microsoft Surface, Desktops, etc. This allows you to create rich dashboards that work on all the devices without compromising on...
 India
India
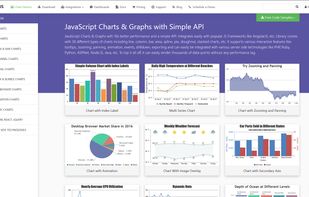
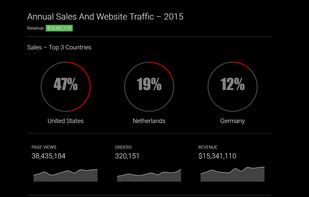


Flexible, cross-platform and cross-browser JavaScript (HTML5) charting library that allows you to create interactive bar, pie, line, spline, area, Gantt, stock and other charts, maps and dashboards, with real-time updates and multi-level drill-downs.
United States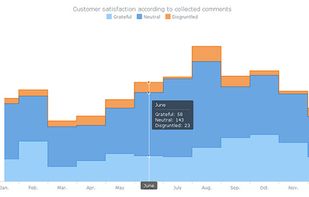
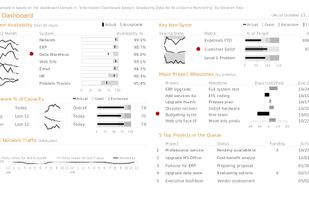
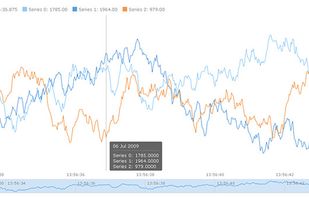
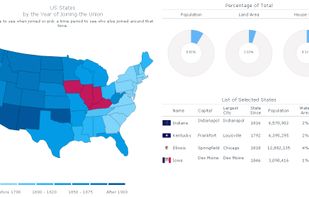

D3-based reusable chart library that enables deeper integration of charts into web applications
 Japan
Japan