
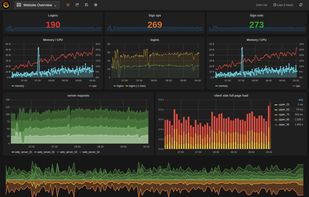
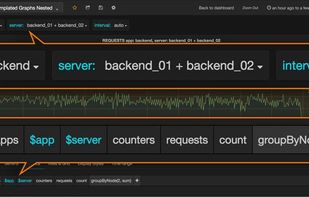
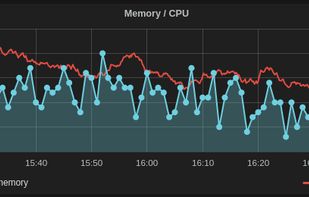
Grafana provides a powerful and elegant way to create, explore, and share dashboards and data with your team and the world.
 Sweden
 EU



+1





Sites and apps similar to We Do Data Science include Grafana, which is open source with a free version. Other options are Metabase, Tableau, RAWGraphs and Microsoft Power BI. You're spoiled for choice with Business Intelligence Tools like We Do Data Science: we list more than 50 alternatives for Windows, self-hosting, Mac, Linux and iPhone.
Grafana provides a powerful and elegant way to create, explore, and share dashboards and data with your team and the world.
SwedenEU
Metabase is a simple and powerful analytics tool which lets anyone learn and make decisions from their company’s data. No technical knowledge required! We hope you love it.
 United States
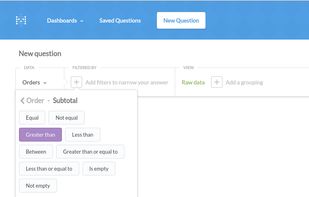
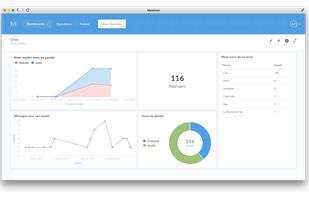


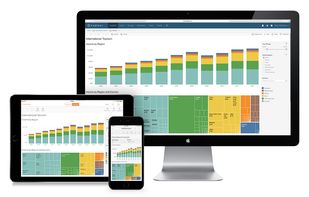
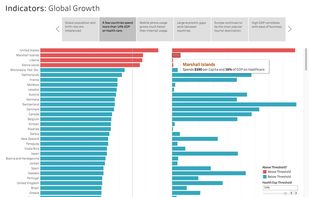
Tableau helps the world’s largest organizations unleash the power of their most valuable assets: their data and their people.
United States


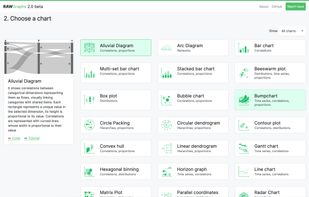
RAWGraphs is an open source app built with the goal of making the visualization of complex data easy for everyone. Born as tool for designers and vis geeks, RAWGraphs aims at providing a missing link between spreadsheets and vector graphics editors.
 ItalyEU


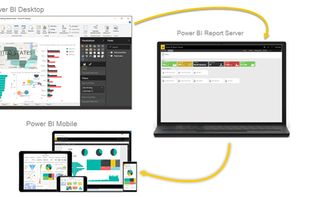
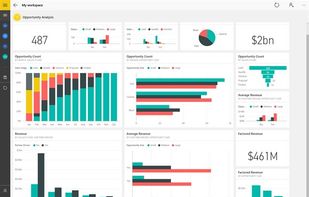
Utilize Microsoft's Power BI to convert varied data sources into interactive visual insights. It includes Power BI Desktop, online services, and mobile apps, allowing the creation, sharing, and consumption of business insights on any device, tailored to diverse business needs.
United States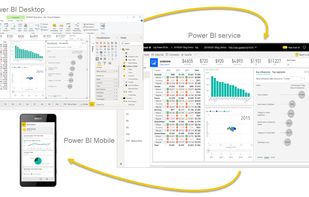



Your business needs software. But because engineers are scarce, many departments (sales, marketing, support, HR, etc.) don’t build the software they need. When companies use Retool, they build much more software, which leads to a more efficient business.
United States


Transforming data to dashboards in seconds, this AI-powered business intelligence tool enables analysts, consultants, and data science teams to rapidly generate visuals, reports, and insights without SQL queries, enhancing collaboration and decision-making across teams.
United States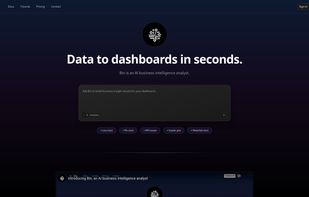


Talend leverages the open source model to make data integration available to all types of organizations, regardless of their size, level of expertise or budgetary constraints. Talend’s solutions connect to all source and target systems and they can be downloaded at no cost.
 FranceEU


Plotly is the easiest way to graph and share data online. Open-source libraries for JavaScript (comparison with HighCharts at https://plot.ly/highcharts-alternative/), Python, R, and MATLAB.
United States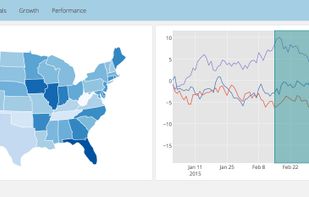
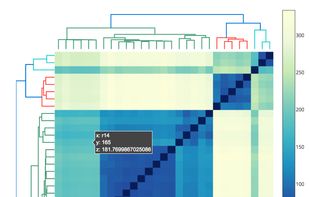
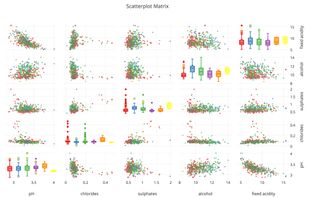


Centralizes metrics and KPIs by connecting 130+ data sources, preparing and merging data, providing real-time dashboards, benchmarks, forecasting, auto-updating reports, AI insights, goal tracking, deep analysis tools, and easy sharing for team decision-making.
United States
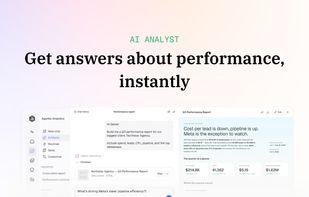


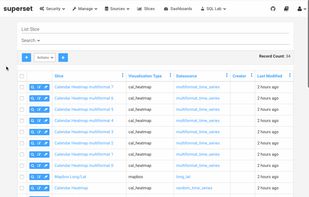
Modern, enterprise-ready business intelligence web application.
United States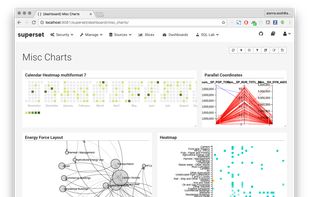


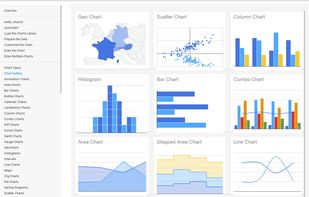
The Google Charts is an extremely simple tool that lets you easily create a chart from some data and embed it in a webpage. You embed the data and formatting parameters in an HTTP request, and Google returns a PNG image of the chart.
United States