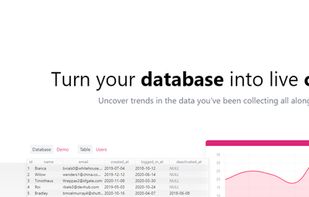
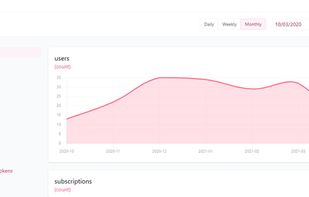
Uncover trends in the data you have been collecting all along. Automatically generate charts from your live database without writing code.
Cost / License
- Paid
- Proprietary
Platforms
- Online
- Software as a Service (SaaS)



Sites and apps similar to We Do Data Science include Grafana, which is open source with a free version. Other options are Metabase, RAWGraphs, Tableau and Microsoft Power BI. You're spoiled for choice with Business Intelligence Tools like We Do Data Science: we list more than 50 alternatives for Windows, self-hosting, Mac, Linux and iPhone.
Uncover trends in the data you have been collecting all along. Automatically generate charts from your live database without writing code.

"Voyager 2 is a data exploration tool that blends manual and automated chart specification."


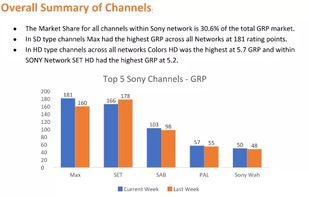
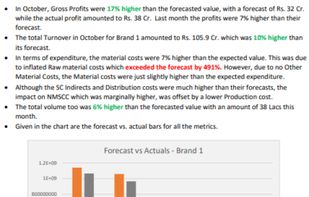
Phrazor summarises data into a few bullet points, highlighting key insights required for decision making. It helps enterprises make their reports and insights easier to comprehend by writing a narrative along with each report.
 United Kingdom


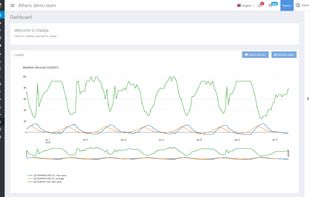
Owlata is a new class of IoT Data Management System (DMS) that works as a global connector for Internet of Things system integration. It automates most of the data processes and connectors, and let you focus on valuable information.
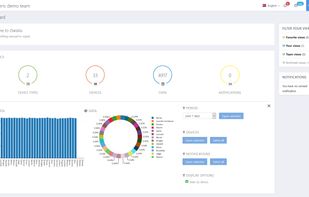
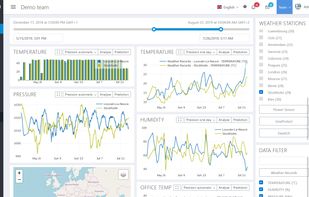


Stratifyd delivers the most comprehensive, unbiased insights from structured and unstructured data in real time. Surface unknown customer insights in real time to improve products, services, and increase revenue.


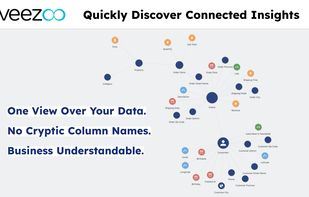
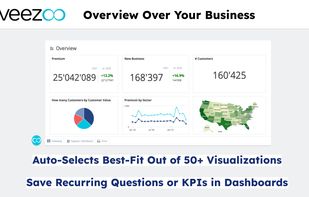
Veezoo is a chat-based data analytics solution that empowers anyone to find actionable insights from data by literally just asking their questions in plain English!
Ask questions and get answers in seconds via meaningful data visualizations.
 Switzerland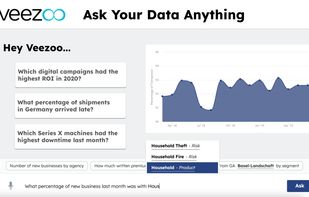
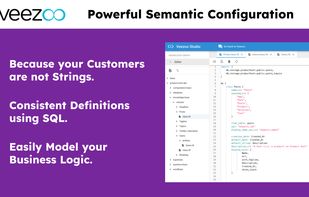


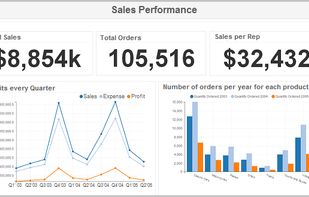
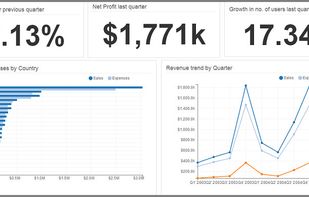
Ubiq is a web-based Reporting and Business Intelligence application. It enables users to easily explore, visualize and analyze data. Users can quickly create reports and dashboards using data visualizations without any programming and share them with others.
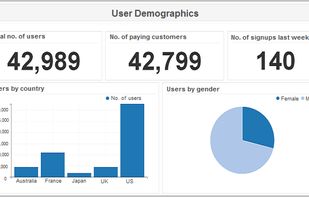
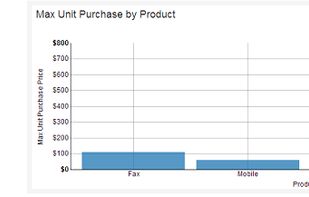


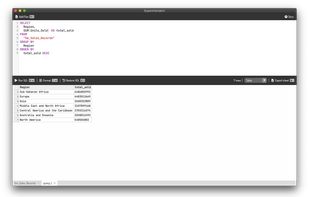
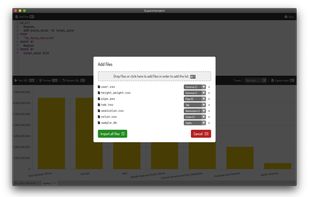
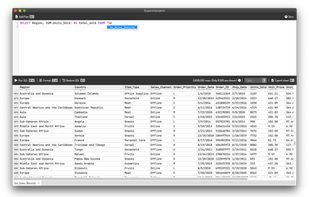
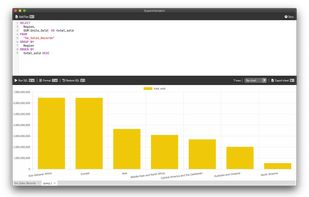
Superintendent.app is a Desktop app that enables you to write SQL on large of small CSV files.


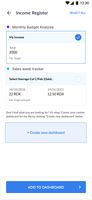
Be at ease when it comes to handling a large quantum of data with Lio business automation. With a vision to empower people to run their businesses smartly, Lio enables you to efficiently organize your business on your mobiles via intuitive solutions.
United Kingdom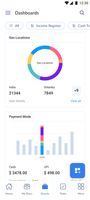


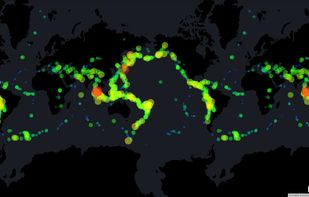
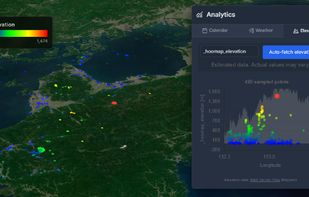
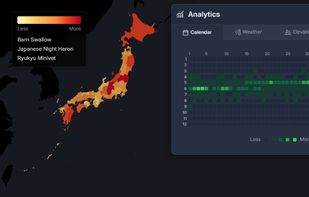
HooMap is a browser-based tool designed to transform CSV and Excel coordinate data into interactive maps in seconds. Built for researchers, students, and data enthusiasts, it allows you to visualize spatial data directly in your workflow without the need for complex GIS software...
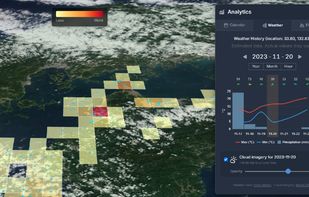


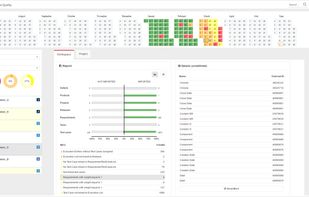
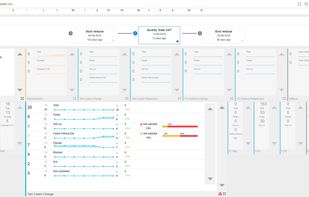
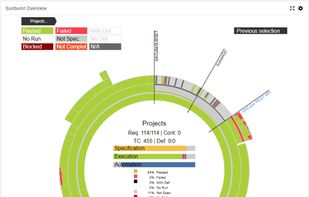
QACube is the software quality reporting and analytics solution for the complex enterprise needing greater agility. QACube delivers dynamic reporting and analytics to improve DevOps, for fact-based decision-making with faster time-to-market.
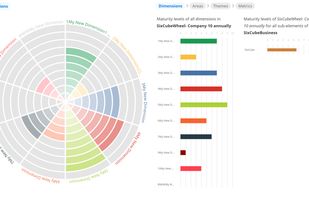


Plug-and-play visual analytics for exploring and preparing large data in much less time – from CSV, Python, and many other sources. Get from millions of data records to discovering correlations, patterns, and trends in 1 minute. No coding required.
 Germany
 EU
EU