
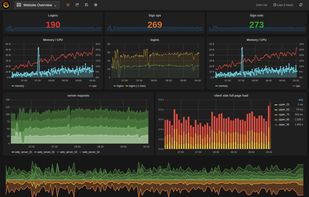
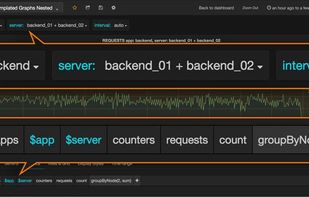
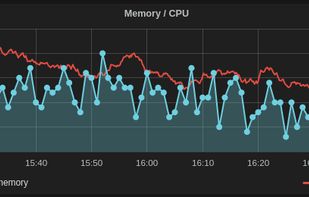
Grafana provides a powerful and elegant way to create, explore, and share dashboards and data with your team and the world.
 Sweden
 EU



+1





Sites and apps similar to RATH include Grafana, which is open source with a free version. Other options are Metabase, Tableau, Microsoft Power BI and Manaflow Bin. You can choose from more than 10 Business Intelligence Tools like RATH for self-hosting, Windows, Mac, Linux and iPad.
Grafana provides a powerful and elegant way to create, explore, and share dashboards and data with your team and the world.
SwedenEU
Metabase is a simple and powerful analytics tool which lets anyone learn and make decisions from their company’s data. No technical knowledge required! We hope you love it.
 United States
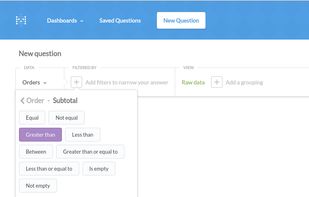
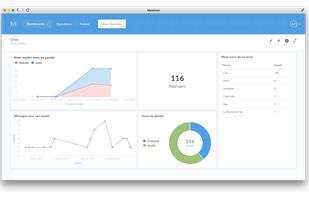


Tableau helps the world’s largest organizations unleash the power of their most valuable assets: their data and their people.
United States
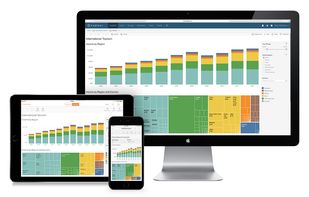


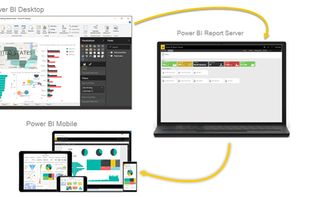
Utilize Microsoft's Power BI to convert varied data sources into interactive visual insights. It includes Power BI Desktop, online services, and mobile apps, allowing the creation, sharing, and consumption of business insights on any device, tailored to diverse business needs.
United States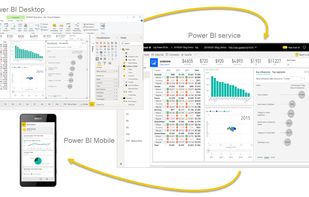

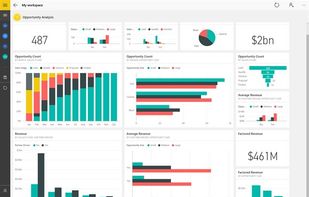


Transforming data to dashboards in seconds, this AI-powered business intelligence tool enables analysts, consultants, and data science teams to rapidly generate visuals, reports, and insights without SQL queries, enhancing collaboration and decision-making across teams.
United States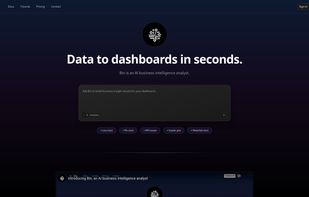


Pretzel is an open-source, offline browser-based tool for fast and intuitive data exploration and visualization. It can handle large data files, runs locally in your browser, and requires no backend setup.
United States


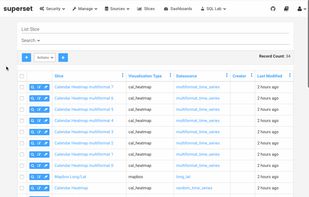
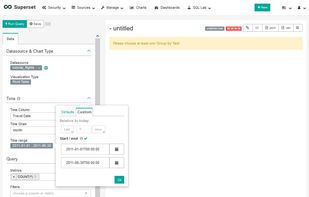
Modern, enterprise-ready business intelligence web application.
United States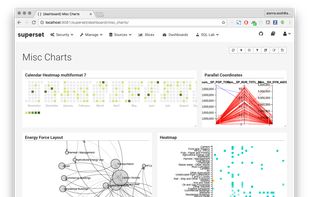
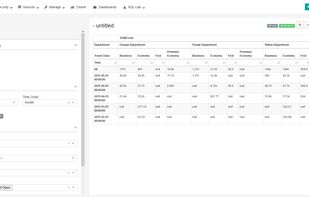


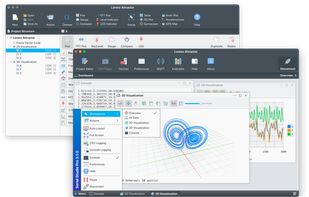
Serial Studio is an open-source, cross-platform telemetry dashboard and real-time data visualization tool. It supports input from serial ports, Bluetooth Low Energy (BLE), and TCP/UDP sockets. It's ideal for embedded devices, external tools, and network services.
 Mexico



 United Kingdom
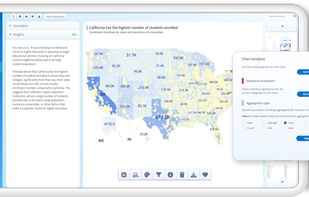


DataMotto empowers anyone to have a proactive AI data analyst. Your AI proactively analyzes your data sources, turns them into valuable insights, and guides you in taking informed decisions.

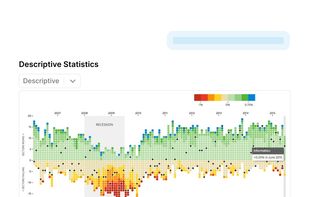


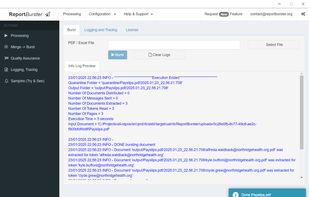
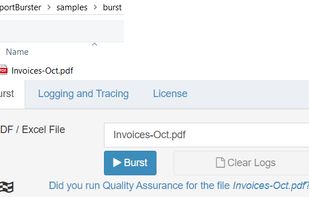
Report generation + report bursting + self-service portal + embeddable analytics. All in one platform. Self-hosted.
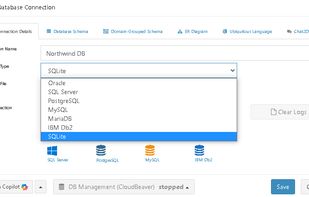


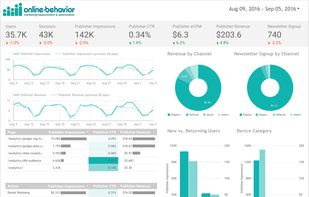
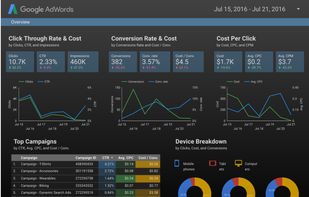
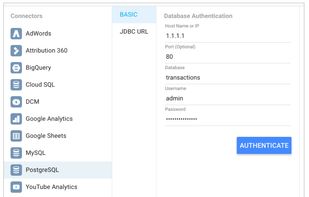
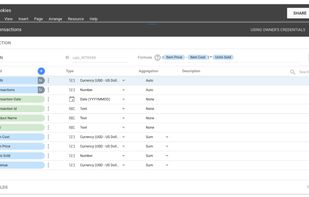
Data visualization and business intelligence (BI) platform for aggregating, sharing, collaborating, and pulling insights from raw databases, as well as built-in connections to Google products.
United States