Project Timeline icon

Project Timeline

 1 like

Free online Gantt chart and timeline maker with built-in AI. Dependencies, critical path, resources and costs, and one-click PNG export straight to your slides.
Project Timeline screenshot 1

Cost / License

  • Freemium
  • Proprietary

Application type

Since

  • New

Platforms

  • Online
1like
0articles
Save

Features

Highlights All activities

Project Timeline News & Activities

Recent activities

Project Timeline information

Project Timeline was added to AlternativeTo by projecttimeline on and this page was last updated .

No comments or reviews, maybe you want to be first?

Official Links

What is Project Timeline?

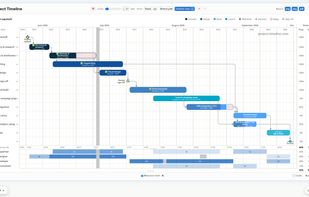
Project Timeline is an online Gantt chart and project timeline maker that runs in your browser. The chart is the editor. You drag bars to move them, drag from an edge to link tasks, and click to set progress. There are no forms to fill in before you see your plan.

You can plan on a compact consolidated timeline that fits several items on each row, or switch to a traditional one-row-per-task Gantt view. Dependencies cascade dates through everything downstream, and the critical path is highlighted automatically as you edit. Scheduling follows real working calendars: weekends, public holidays for 14 countries and each person's days off are all skipped.

Built-in Timeline AI edits the plan from plain English. For example, you can type "shift everything after Visual design by two weeks" or "create a draft project plan for a product launch". It also answers questions about the plan, and every change is one undo away.

With Pro, you can ask Claude, ChatGPT or Grok to add a Jira epic. It arrives as a project, sorted into phases, with a link back to every ticket. Plan the dates here, and the assistant writes the start and due dates back to Jira. Project Timeline itself never connects to Jira.

Resource utilisation sits right under the schedule as a heat-map, so you can see who is overloaded. Give people day rates and the chart totals costs per task, per resource and per project. Baselines show how far the plan has slipped against the original, in days and in cost.

When the plan is ready, hit PNG and the chart is copied to your clipboard as it downloads. Paste it into PowerPoint, Google Slides or Keynote. You can also export vector SVG, PDF with clickable links, CSV or JSON.

Coming from GanttProject? Your .gan files import directly, with tasks, dates, progress, people and links.

The chart editor is free and doesn't need an account. Pro (€3.99/month or €34.99/year, or $4.99/$39.99 in the US; 14-day free trial) raises the limits and adds sharing, teams, baselines, saved templates, a Team Project View and Jira sync. The app is available in English, French, German, Italian, Dutch and Spanish.