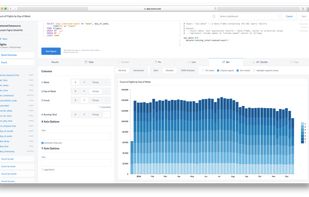
This project is an attempt to build re-usable charts and chart components for d3.js without taking away the power that d3.js gives you. This is a very young collection of components, with the goal of keeping these components very customizeable, staying away from your standard...
Bime Alternatives
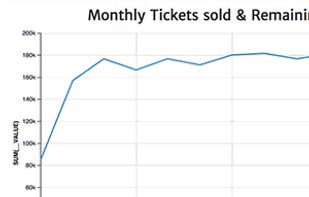
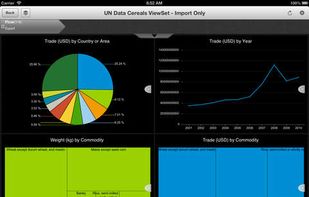
Bime is described as 'BIME allows you to connect to both the online and the on-premise world in the same place. Create connections to all your data sources, create and execute queries and view your dashboards easily - all within BIME's beautifully intuitive interface' and is a business intelligence tool in the business & commerce category. There are more than 25 alternatives to Bime, not only websites but also apps for a variety of platforms, including Windows, Mac, Linux and Self-Hosted apps. The best Bime alternative is Tableau. It's not free, so if you're looking for a free alternative, you could try Microsoft Power BI or Plotly. Other great sites and apps similar to Bime are LinceBI, Windward Core - Document Generation Component, Redash and Amazon QuickSight.
Alternatives list


 80 Looker Studio alternatives
Data visualization and business intelligence (BI) platform for aggregating, sharing, collaborating, and pulling insights from raw databases, as well as built-in connections to Google products.
 +1
+1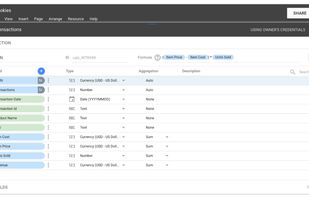


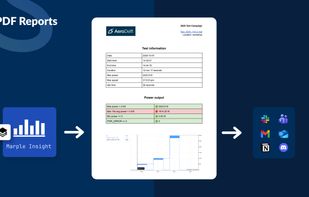
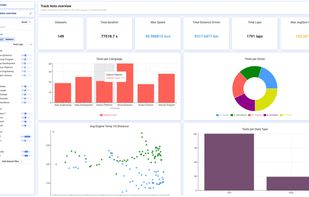
Marple Insight offers powerful tools for interactive analysis of high-frequency time-series data. Engineers and scientists from automotive, aerospace and manufacturing use it to explore, visualise, and analyse sensor or test data.
Cost / License
- Paid
- Proprietary
Platforms
- Online
- Software as a Service (SaaS)
- Self-Hosted
 +2
+2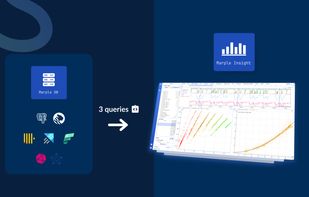


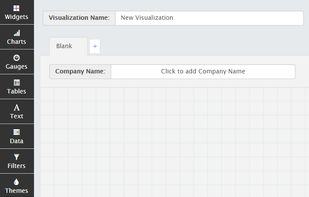
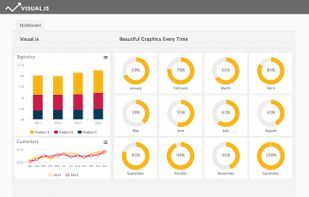
Visual.is was founded on the belief that by maximizing the visual impact of your data, you can transform your business. We are experienced designers and programmers who believe in the value of beautiful information design.
Cost / License
- Freemium
- Proprietary
Platforms
- Online


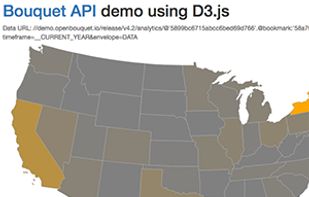
Bouquet automatically generates REST API endpoints for front-end developers to focus on UX and visualizations with HighCharts, D3.js and others.
Cost / License
- Free
- Open Source
Application type
Alerts
- Discontinued
Platforms
- Mac
- Windows
- Linux
- Self-Hosted
 +5
+5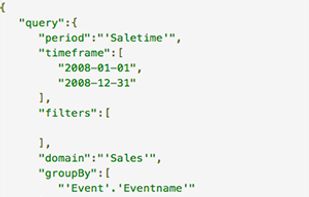


Viur allows you to do business analytics on top of your operational databases (also CRM, ERP databases), cloud services and files. It's a Business Intelligence tool that anyone can use.

 27 SAP BusinessObjects alternatives
A business intelligence tool that includes ad hoc reporting, self-service data visualization and dashboards, predictive analytics, mobile apps, and more.
Cost / License
- Paid
- Proprietary
Application type
Platforms
- Windows
- Android
- iPhone
- Android Tablet
- iPad
 +3
+3


datapine enables people to explore, visualize and share data in one central analytics platform, that offers smart data connectors, a wealth of advanced BI 4.0 features and interactive dashboards.
Cost / License
- Paid
- Proprietary
Application type
Platforms
- Mac
- Windows
- Online
- Android
- iPhone
- Android Tablet
- iPad
- Software as a Service (SaaS)

 +1
+1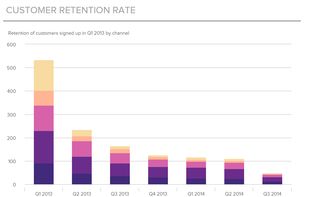


Holistics helps you prepare, query, visualize and share information from your database to access business reports and dashboards online.


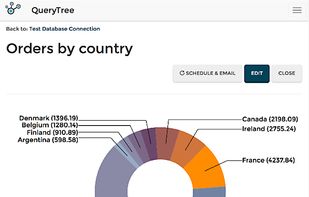
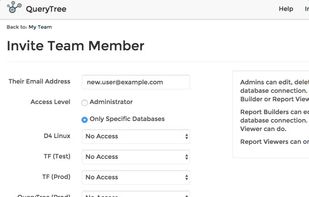
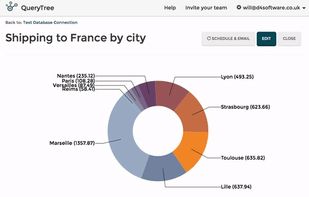
QueryTree is a flexible and powerful database reporting tool. Simply connect your database and start visualizing your data in minutes. Everything works with a dropdown menu interface - no code or SQL needed.
Cost / License
- Free Personal
- Open Source (LGPL-3.0)
Platforms
- Windows
- Online
- Self-Hosted
 +3
+3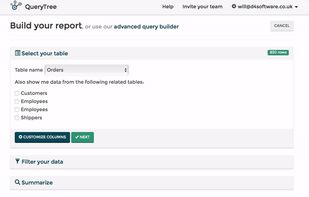


Cluvio is the #1 cloud BI platform for startups and data-driven teams, trusted by over 300 companies. Use SQL and R to analyze your data and in few minutes create beautiful, interactive dashboards for your entire company.
Cost / License
- Paid
- Proprietary
Application type
Platforms
- Mac
- Windows
- Linux
- Online
- Android
- iPhone
- iPad
- Self-Hosted
- Software as a Service (SaaS)