


Agile Data Discovery, Preparation and Analytics
An agile, collaborative tool that helps you integrate, prepare, explore, analyze and share your data.
Platforms
- Online


Sites and apps similar to Bime include Tableau, which has a free version. Other options are Microsoft Power BI, Plotly, Redash and Amazon QuickSight. Business Intelligence Tools like Bime are a crowded field, with more than 25 alternatives for Windows, Mac, Linux, self-hosting and iPhone.
Agile Data Discovery, Preparation and Analytics
An agile, collaborative tool that helps you integrate, prepare, explore, analyze and share your data.

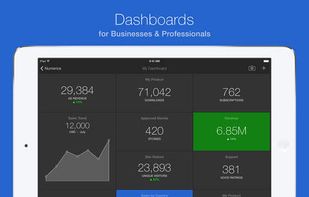
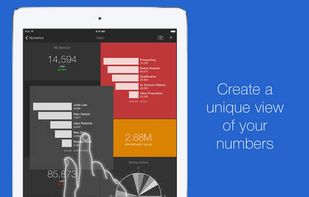
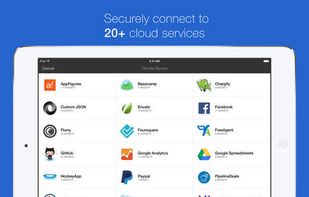
Visualize all your vital business statistics, live, in one place. Numerics helps you know your numbers, focus on your goals and make better decisions.
 India


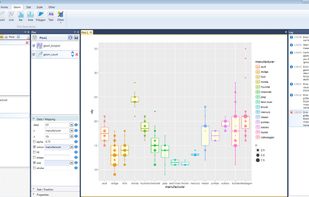
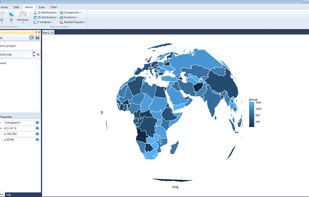
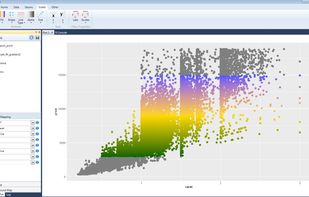
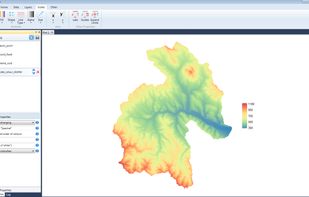
Stagraph is new professional tool for visual data exploration and statistical graphics. This tool brings data science features and functions of R language to user without the need of coding. Your workflow in software is as follows:


Ubiq is a web-based Reporting and Business Intelligence application. It enables users to easily explore, visualize and analyze data. Users can quickly create reports and dashboards using data visualizations without any programming and share them with others.
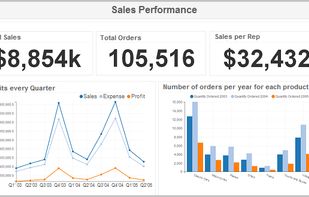
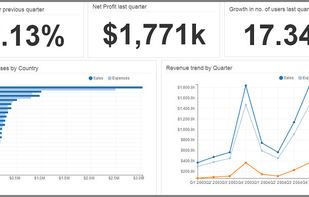
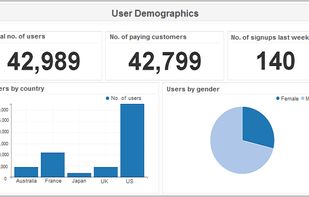
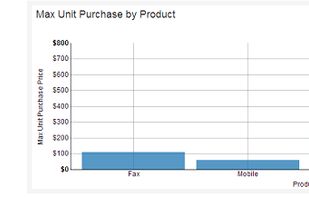


ReportDash enables you to create highly customizable reports and dashboards from all your important marketing data sources like Adwords, Google Analytics, Facebook Ads and Insights, Bing Ads, Instagram, Twitter, Google Sheets, CSV/Excel and more.
 United States


A global leader in business intelligence technology, MicroStrategy provides integrated reporting, analysis, and monitoring software that enables companies to analyze the data stored across their enterprise to make better business decisions.


Looker gives you access to your organization’s data. Many users start by browsing through the reports - which we call “Looks” - and dashboards that others in their organization have already created. This page will show you how to get started browsing.
United States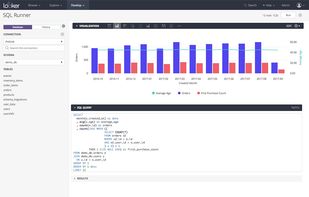


Tercept automatically aggregates and organizes all monetization data,analytics data and marketing data into one single dashboard with powerful querying and visualization capabilities. You can setup custom reports and automate 100% of your reporting.
India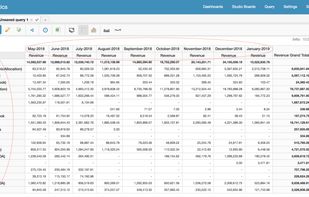

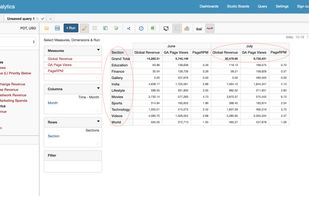
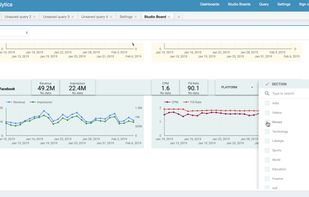


An intuitive Artificial Intelligence-powered business analytics software that uses aesthetically beautiful graphics to help translate raw data into company value.
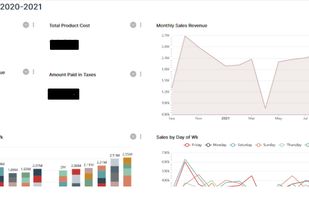
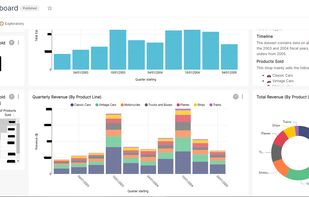
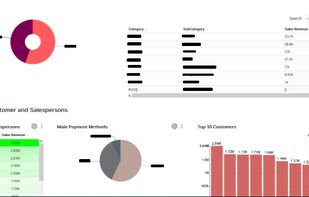


Full fledge AI (MCP, API, Agents) Analytics (Sheets on data lake) and Business Intelligence Platform (Charts, dashboards and reports).


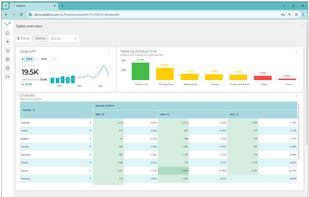
Edalitics is an open-source business intelligence platform that lets you build interactive dashboards, analyze data from multiple sources, and connect AI assistants to your business data in minutes.
 Spain
 EU


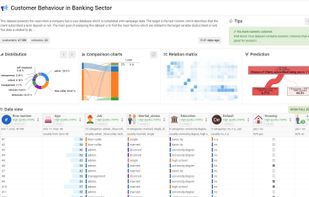
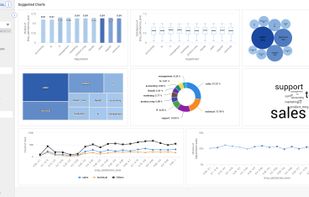
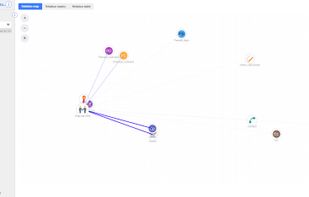
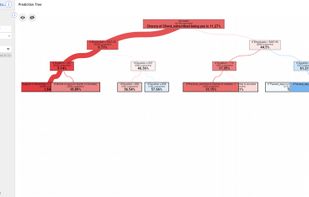
An amazing and fast data exploration tool with many unique features like prediction tree, automatic charts, relation map and report (canvas).


 Sweden


