Apps with 'Data visualization' feature Page 5 of 33

All apps in Apps with 'Data visualization' feature category. Use the filters below to narrow down your search. 
Copy a direct link to this comment to your clipboard
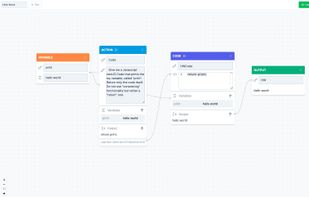
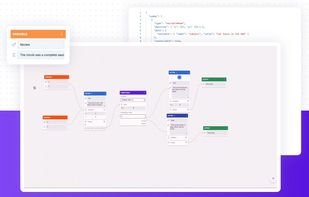
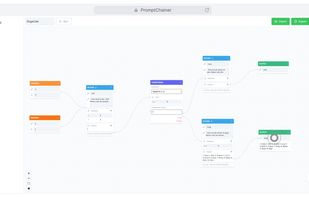
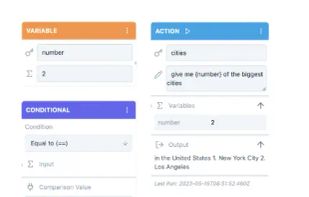
  1. PromptChainer is a visual flow builder tool that enables users to create complex AI-driven flows with ease. It allows for the seamless integration of AI and traditional programming, chaining of prompts and models, and the management of AI-generated insights on large-scale data.

    Cost / License

    • Freemium
    • Proprietary

    Since

    • Since 2023

    Platforms

    • Online
    PromptChainer screenshot 1
    PromptChainer screenshot 1
    PromptChainer screenshot 2
    +2
    PromptChainer screenshot 3
    5 alternatives
  2. Flywheel helps B2B SaaS companies convert free users to paying customers. Discover which marketing campaigns and tactics drive product adoption in minutes.

    Cost / License

    • Freemium (Subscription)
    • Proprietary

    Since

    • Since 2023

    Platforms

    • Online
    • US flagUnited States
    Home screen in Flywheel
    16 alternatives
  3. Anania icon
     Like

    Anania is a search and AI-Driven analytics platform that provides analytical insights to non-technical people with English search queries.

    Cost / License

    • Freemium (Subscription)
    • Proprietary

    Since

    • Since 2022

    Platforms

    • Software as a Service (SaaS)
    Search
    Analyze
    Visualise
    Extract
  4. ERD Lab icon
     Like

    ERD Lab is an online ER Diagram Tool that allows you to visually design your database.

    Cost / License

    • Free
    • Proprietary

    Since

    • Since 2023

    Platforms

    • Windows
    • Online
    Fast, Efficient & Reliable
    Feature Rich
    Powerful Visualization
    Made For Enterprise Users
    13 alternatives
  5. The ultimate tool to analyze TikTok live streaming data and generate insightful report for you.

    Cost / License

    • Pay once or Subscription
    • Proprietary

    Since

    • Since 2022

    Platforms

    • Online
    Basic info about a live room
    Rank list of TikTok live.
    Basic info about a live room
    +9
    Live line chart
    3 alternatives
  6. Datazip icon
     Like

    Datazip helps you centralize and visualize the data insight you need in under 40-minutes, without the engineering effort.

    Cost / License

    • Freemium (Subscription)
    • Proprietary

    Since

    • Since 2023

    Platforms

    • Self-Hosted
    Sample Dashboard
    Sample Dashboard
    150+ integrated connectors
    +3
    SQL editor for quick transformation
    3 alternatives
  7. Mapify is an end-to-end platform to manage and process real-time geospatial data and generate real-time insights.

    Cost / License

    • Subscription
    • Proprietary

    Since

    • Since 2023

    Platforms

    • Online
    Style your layers according to the values of the data attributes, which will allow you to present location data visualizations to your users in a way that is readable and attractive. No need to code, just drag-and-drop.
    Use workflows to process incoming real-time data and trigger automatic actions. Quickly implement your business rules without any coding, and run it completely scalable on the cloud. Each workflow has its own performance-monitoring dashboard.
    See your data on a map, updated in real-time and share it publicly or in private. You’re able to customize how your map app looks, such as selecting the icon, cover image, header image, and much more.
    23 alternatives
  8. DashThis icon
     3 likes

    DashThis provides marketers with an easy-to-use, automated & attractive reporting tool. DashThis is integrated with over 34+ data sources, and is known as the best in the business in terms of customer support.

    Cost / License

    • Subscription
    • Proprietary

    Since

    • Since 2017

    Platforms

    • Online
    • Self-Hosted
    • CA flagCanada
    DashThis screenshot 1
    DashThis screenshot 1
    DashThis screenshot 2
    DashThis screenshot 3
    71 alternatives
  9. Duck UI icon
     1 like

    Duck-UI is a web-based interface for interacting with DuckDB, a high-performance analytical database system. This project leverages DuckDB's WebAssembly (WASM) capabilities to provide a seamless and efficient user experience directly in the browser.

    Cost / License

    • Free
    • Open Source

    Since

    • Since 2025 (updated Oct 2026)

    GitHub

    • GitHub stars: 660

    Platforms

    • Self-Hosted
    • Docker
    • ES flagSpain
    • European Union flagEU
    Duck UI screenshot 1
  10. Loreshelf icon
     10 likes

    Loreshelf is an Open Source knowledge archive that enables you to organize your data and reduce the information noise from original sources such as contracts, services, properties, regulations, and others.

    Cost / License

    Application type

    Since

    • Since 2020 (updated Sep 2021)

    Alerts

    • Discontinued

    GitHub

    • GitHub stars: 22

    Platforms

    • Windows
    • Mac
    • Linux
    Loreshelf screenshot 1
    Loreshelf screenshot 1
    Loreshelf screenshot 2
    +1
    Loreshelf screenshot 3
    5 alternatives
  11. DJI Logbook icon
     1 like

    A high-performance universal desktop dashboard application for analyzing DJI drone flight logs. Built with Tauri v2, DuckDB, and React.

    Cost / License

    Since

    • Since 2026 (updated Nov 2026)

    GitHub

    • GitHub stars: 1.6k

    Platforms

    • Windows
    • Mac
    • Linux
    • Self-Hosted
    • Docker
    • IN flagIndia
    DJI Logbook screenshot 1
    DJI Logbook screenshot 1
    DJI Logbook screenshot 2
    +2
    DJI Logbook screenshot 3
    1 alternative
  12. VisiData icon
     4 likes

    VisiData is an advanced data analysis and visualization tool for the commandline featuring a Vim workflow. It combines the clarity of a spreadsheet, the efficiency of the terminal, and the power of Python, into a lightweight utility...

    Cost / License

    Application type

    Since

    • Since 2019 (updated Nov 2026)

    GitHub

    • GitHub stars: 9.5k

    Platforms

    • Windows
    • Mac
    • Linux
    • US flagUnited States
    VisiData screenshot 1
    VisiData screenshot 1
    VisiData screenshot 2
    5 alternatives
  13. Report generation + report bursting + self-service portal + embeddable analytics. All in one platform. Self-hosted.

    Cost / License

    • Free
    • Open Source

    Since

    • Since 2026 (updated Nov 2026)

    GitHub

    • GitHub stars: 82

    Platforms

    • Windows
    • Linux
    • Java
    ReportBurster screenshot 1
    ReportBurster screenshot 1
    ReportBurster screenshot 2
    +1
    ReportBurster screenshot 3
    93 alternatives
  14. binjr icon
     1 like

    binjr is a standalone time series browser. It renders time series data produced by other applications as dynamically editable views and provides advanced features to navigate the data smoothly and efficiently.

    Cost / License

    Since

    • Since 2025 (updated Nov 2026)

    GitHub

    • GitHub stars: 371

    Platforms

    • Windows
    • Linux
    • Flathub
    • Flatpak
    • FR flagFrance
    • European Union flagEU
    binjr screenshot 1
    binjr screenshot 1
    binjr screenshot 2
  15. Frappé Charts is a simple, responsive, modern charts library for the web with zero dependencies and a roughly 15k gzipped file size. From the makers of ERPNext, the library offers a fast alternative with minimal effort needed to visualize data in sleek charts.

    Cost / License

    • Free
    • Open Source

    Application type

    Since

    • Since 2017

    Platforms

    • Self-Hosted
    • IN flagIndia
    Frappé Charts screenshot 1
    Frappé Charts screenshot 1
    21 alternatives
  16. D8A icon
     1 like

    D8A helps aspiring data analysts become job-ready. Follow a clear skill tree, build portfolio projects, get monthly 1-on-1 mentoring, and join a 550+ community. Built with learner feedback.

    Cost / License

    • Pay once or Subscription
    • Proprietary

    Since

    • Since 2025

    Platforms

    • Online
    • FR flagFrance
    • European Union flagEU
    D8A screenshot 1
  17. Pentaho icon
     27 likes

    Pentaho is a Business Intelligence software company that offers Pentaho Business Analytics, a suite of open source products which provide data integration, OLAP services, reporting, dashboarding, data mining and ETL capabilities.

    Cost / License

    • Pay once
    • Proprietary

    Since

    • Since 2010

    Platforms

    • Windows
    • Linux
    • US flagUnited States
    Pentaho screenshot 1
    130 alternatives
  18. Access a variety of free online tools designed to simplify daily tasks, including those for AI, creativity, finance, productivity, and more. Your data remains private and local.

    Cost / License

    • Free
    • Proprietary

    Application type

    Since

    • Since 2025

    Platforms

    • Online
    • IN flagIndia
    Tools Menu
    Tools Menu
    Tools Menu
    13 alternatives
  19. Looker Studio icon
     20 likes

    Data visualization and business intelligence (BI) platform for aggregating, sharing, collaborating, and pulling insights from raw databases, as well as built-in connections to Google products.

    Cost / License

    • Freemium
    • Proprietary

    Since

    • Since 2017

    Platforms

    • Online
    • US flagUnited States
    Sample dashboard, showing KPIs and custom branding in the report
    There are built in connectors and templates for Official Google Marketing Products (such as AdWords and Analytics).
    There are a ton of connection options, and more are being constantly added, such as PostgreSQL.
    You can transform data on the fly, without modifying your original data source - even adding new dimensions and metrics based on custom formulas.
    104 alternatives
  20. MongoQUI icon
     1 like

    MongoQUI is a MongoDB GUI for querying, editing and managing databases, with AI-assisted queries, aggregation tools and shareable dashboards.

    Cost / License

    • Freemium (Subscription)
    • Proprietary

    Application type

    Since

    • New

    Platforms

    • Windows
    • Mac
    • Linux
    • Online
    • AE flagUnited Arab Emirates
    AI-Powered MongoDB Queries
    Run AI Queries with Review First
    Visual Query Builder
    +5
    Aggregation Builder and Results
    10 alternatives
  21. SafeUtils icon
     3 likes

    SafeUtils: Native MacOS, Linux and Windows desktop application with 110+ carefully crafted tools for yours and your teams everyday work with sensitive data in various formats.

    Cost / License

    Since

    • Since 2024 (updated Jun 2024)

    Platforms

    • Windows
    • Mac
    • Linux
    • Chrome OS
    • Online
    SafeUtils screenshot 1
    SafeUtils screenshot 1
    18 alternatives
  22. AutoPlot icon
     2 likes

    Native scientific workspace for macOS enables exploratory data analysis, importing tabular datasets, creating X&Y, 3D plots, histograms, heat maps, and composing figures with vector export.

    Cost / License

    • Freemium (Subscription)
    • Proprietary

    Since

    • Since 2026

    Platforms

    • Mac
    Fit Fit Distributions Fast
    Import Data
    Ask, Confirm, Plot
    +2
    Explore data in 3D
  23. Shooglebox  icon
     2 likes

    Shooglebox helps you gather, explore and make sense of information from multiple sources – and create inspiring at-a-glance outputs to share with others.

    Cost / License

    • Freemium
    • Proprietary

    Since

    • Since 2023 (updated Nov 2026)

    Platforms

    • Online
    • iPhone
    • iPad
    • GB flagUnited Kingdom
    Shooglebox  screenshot 1
    Shooglebox  screenshot 2
    Shooglebox  screenshot 3
  24. Paraview icon
     12 likes

    ParaView is an open-source, multi-platform application designed to visualize data sets of size varying from small to very large.

    Cost / License

    • Free
    • Open Source

    Since

    • Since 2013

    Platforms

    • Windows
    • Mac
    • Linux
    9 alternatives