


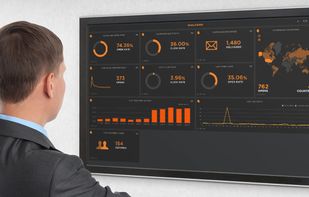
HappyMetrix lets you create beautiful dashboards, collecting validated data from diverse sources.Cut through the clutter, interpret the numbers and get things done.
 Belgium
 EU






+5

Best alternatives are 

34 alternatives


HappyMetrix lets you create beautiful dashboards, collecting validated data from diverse sources.Cut through the clutter, interpret the numbers and get things done.
BelgiumEU
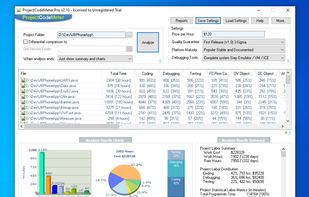
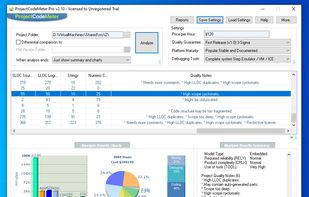
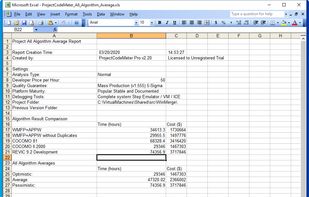
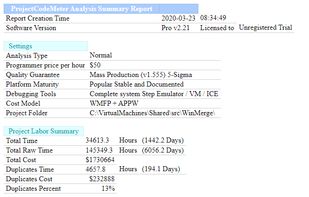
ProjectCodeMeter Is a professional software tool for project managers to measure and estimate the Time, Cost, Complexity, Quality Metrics and Maintainability of software projects as well as Development Team Productivity by analyzing their source code.

MRR.io gives you the access to the most important metrics for your SaaS business in one click, for free.


Code analysis tool, including breakdown of developer contributions, and a clear breakdown of different types of problems with trends over time.

Braintree analytics for your SaaS, subscription and recurring revenue business. Within minutes you’ll gain insights into your MRR, LTV, churn rate, plus more.


LinearB delivers software leaders the insights they need to make their engineering teams better through a real-time SaaS platform. Visibility into key metrics paired with automated improvement actions enables software leaders to deliver more.
 United States


Vaetas gives users a simple and powerful way to add GIF-in-email, video viewing metrics, and a strong Call-To-Action for videos. Cut through the signal to noise and communicate effectively.
United States


Instrumental is an application and infrastructure monitoring service for large scale web and mobile apps. We go beyond basic hardware, server and performance monitoring. If it moves, our customizable metrics can graph it, and our powerful query language will help you analyze...


Web analytics tool, than everyone can use. With infographics, that everyone can understand.
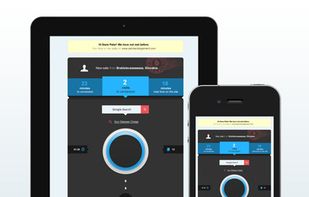

Oracle Business Indicators is a business intelligence application that provides real-time, secure access to business performance information on the mobile device.
United States




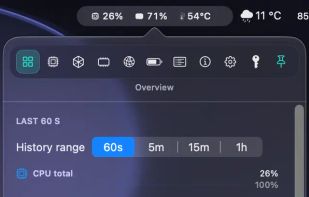
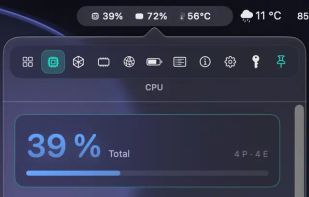
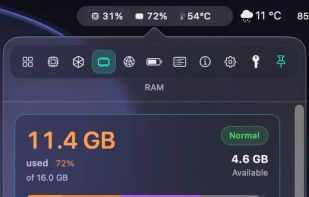
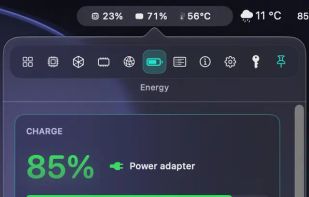
Live CPU, GPU, RAM, and thermal data directly in your macOS menu bar. Native for Apple Silicon, private by design, and built for fast first-glance insight.
 GermanyEU


Graphite compatible cloud-hosted monitoring. Track in real-time at any scale without dramatic price increase. Start a free trial today.

Creating a dashboard for your office space is a cool idea that many realise early on, a good dashboard will affect the motivation and engagement of your team. We created a SaaS solution that gives you the power to create a beautiful themed dashboard in minutes.





Ultralight open source server monitoring agent, written in Rust. Ships CPU, RAM, disk and network metrics over OTLP to any compatible backend.
 Uptime Kumaand


Stop hunting through multiple dashboards to answer one question. MetricNexus lets you ask your AI assistant about
 United Kingdom



Music marketing intelligence & analytics - see every meta ad any artist is running, along with Spotify popularity, streaming statistics, and social media data.
United States


 United States


A software design quality assessment tool that identifies architecture, design, and implementation smells in your code to reduce technical debt and improve maintainability.

Hosted Graphite providing scalable application and software metrics and monitoring, as well as hosted grafana graphs, StatsD, and AWS stats.
United States
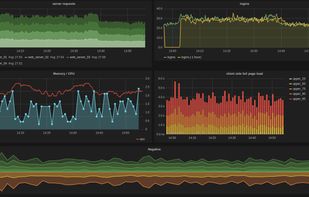
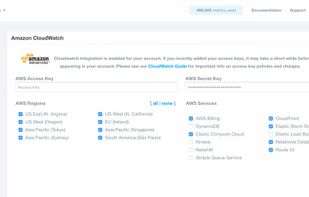

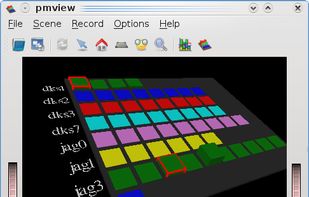
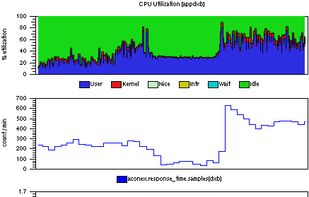
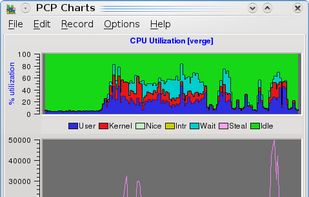
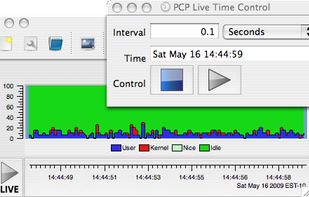
Performance Co-Pilot (PCP) provides a framework and services to support system-level performance monitoring and management. It presents a unifying abstraction for all of the performance data in a system, and many tools for interrogating, retrieving and processing that data.
 Australia

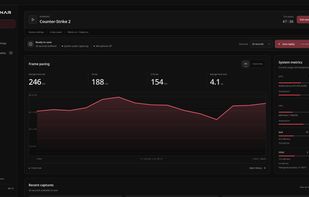
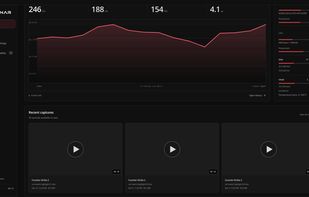
Redunar is a native Linux gaming app that continuously captures recent gameplay for instant replay. Save recent moments with a shortcut, then play, trim, compress, and export clips locally. Its configurable in-game overlay shows FPS, frame time, GPU and CPU usage, temperatures...
 NetherlandsEU




Use your favorite StatsD lib to generate custom metrics from your code and systems. We store them in your choice of metrics platform. As you'd expect, we provide Grafana for dashboards, and you also have the ability to configure alerts as needed.
United States


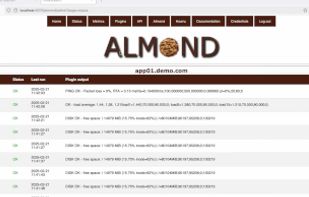
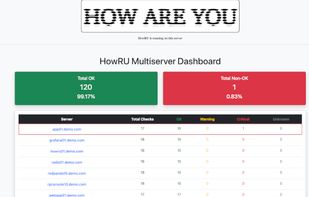
Monitoring agent using Nagios plugins providing JSON API, Prometheus metrics, Kafka integration making it able to connect to anything.
 SwedenEU

Your key metrics in a beautiful daily email. Get your key metrics from anywhere (Stripe, Google Analytics, Twitter, Facebook, your own internal metrics...) and have them delivered to you and your team every morning... no code needed!!.


Neonmetrics aggregates and processes data from all your marketing platforms to help you design the perfect reports for you or your clients.





 Poland


 Spain