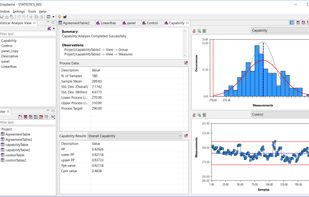
Statistics software for quality. Offers a set of industrial tools to improve product performance, manage processes and solve problems.
Cost / License
- Paid
- Proprietary
Platforms
- Windows
- Linux
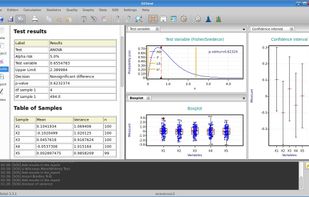

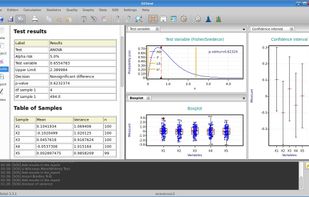


One of the most popular alternatives to Minitab is R (programming language), which is free and open source. Other popular alternatives are RStudio, Matplotlib, PSPP and JASP. Statistical Analyzers like Minitab are a crowded field, with more than 50 alternatives for Windows, Linux, Mac, the web and iPad.
Statistics software for quality. Offers a set of industrial tools to improve product performance, manage processes and solve problems.

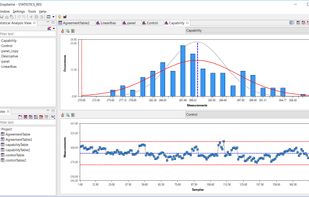
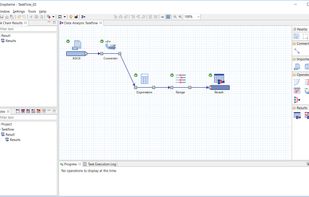
Grapheme is an intuitive and powerful data visualization and analysis tool. Grapheme brings you advanced data analysis capabilities along with interactive plotting functionalities to enable exploring and understanding complex sets of data.


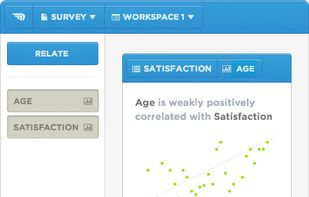
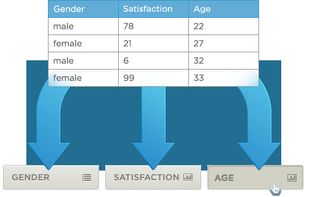
Statwing was built by and for analysts, so you can clean data, explore relationships, and create charts in minutes instead of hours. Simply upload your spreadsheet or dataset, then select the relationships you want to explore.
 United States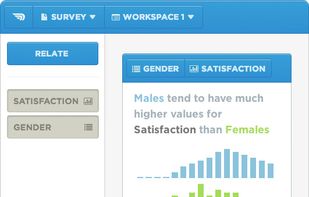


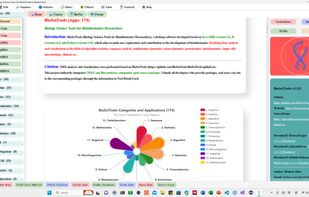
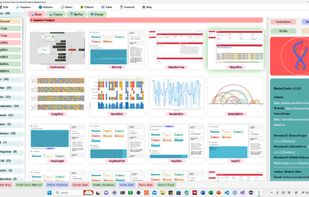
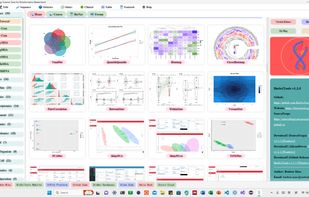
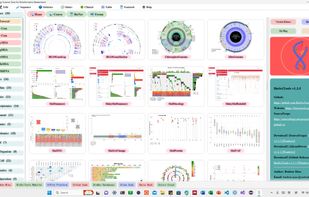
BioSciTools (Bioinformatics Science Tools), a desktop program developed based on Java 11, aims to make new exploration and contribution to the development of bioinformatics, and realize data analysis and visualization in the fields of sequence analysis, multi-omics...


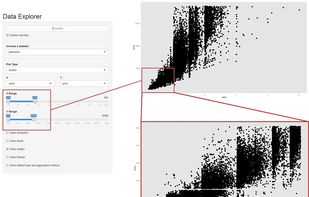
ggraptR is an open source R package providing a GUI for visualization. It is based on principles of visualization analysis by Tamara Munzner, and also acts as a wrapper for functionality implemented in the grammar of graphics for R, ggplot2.
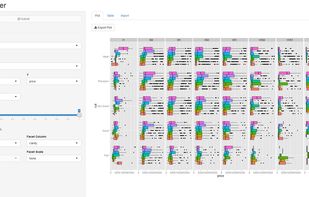


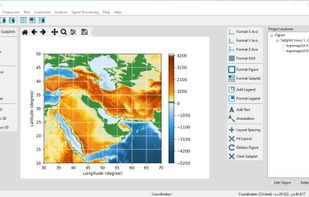
AsanPlot, is a free and easy to use plotting software based on the Matplotlib library for preparing high quality plots. This software provides features for the most common 2d and 3d plots. It can import data from different file types, preprocess, clean, analyze, and visualize...

MonteCarlito is a free Excel-add-in to do Monte-Carlo-simulations. Apart from these it can also do statistical analysis like mean, median, standard error, variance, skewness, kurtosis. It can create histograms. The code is open source.
 Austria
 EU
EU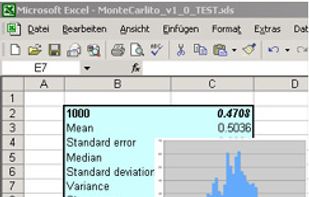

A simple Six Sigma Calculator Firefox and Opera Add-on to calculate the DPM value.



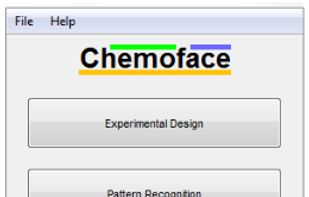
Chemoface is a novel free user-friendly interface for chemometrics. Chemoface comprises modules that can solve problems related to experimental design, pattern recognition, classification and multivariate calibration.


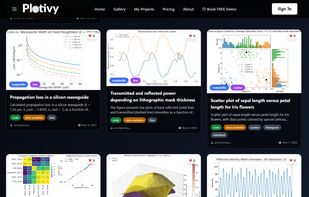
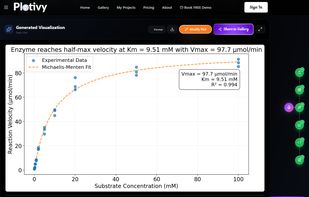
Plotivy is a modern, AI-assisted platform designed specifically for scientific data visualization and image analysis. Built by an experimental physicist for researchers who want to focus on science rather than wrestling with plotting libraries.
 ItalyEU



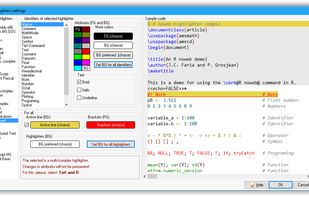
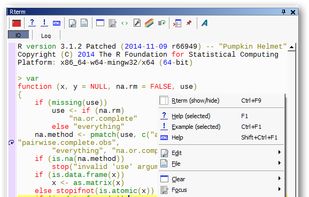
Tinn-R, the R code editor Tinn stands for the recursive acronym 'Tinn is not Notepad'. It is initially written as a small ASCII file editor primarily intended as a better replacement for the default Notepad.exe program distributed with Windows. With versions, it grew to a.




Description
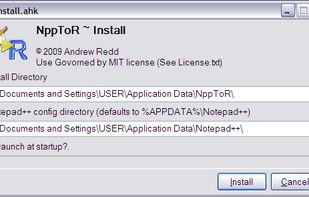
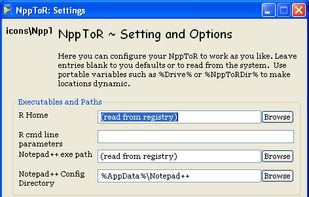
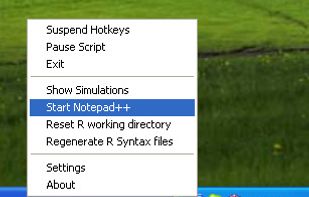
Similar to the windows R gui built in editor, NppToR aims to extend the functionality of code passing to the Notepad++ code editor. In addition to passing to the R gui, NppToR provides optional passing to a PuTTY window for passing to an R instance a remote machine.